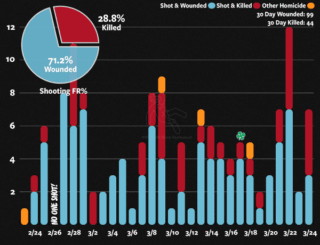
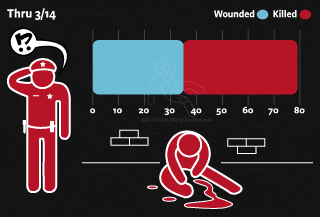
March To Date
Shot & Killed: 32
Shot & Wounded: 79
Total Shot: 111
Total Homicides: 36
March To Date
Shot & Killed: 32
Shot & Wounded: 79
Total Shot: 111
Total Homicides: 36
Week in Progress (3/22 – 3/28)
Shot & Killed: 9
Shot & Wounded: 13
Total Shot: 22
Total Homicides: 9
Year to Date
Shot & Killed: 86
Shot & Wounded: 264
Total Shot: 350
Total Homicides: 94
 Our local press has ditched “mostly peaceful” for the newest nonsense phrase of “wrong place, wrong time”. Because it’s perfect for describing certain “isolated incidents”, such as random murders and deadly arsons, we’ll roll with it until the next mostly-peaceful-often-violent
 protest riot requires a new moniker.
Final Demonized Tally: 7 killed, 14 wounded
2025 weekend tally: 8 killed, 9 wounded
2024 weekend tally: 0 killed, 13 wounded
2023 weekend tally: 4 killed, 16 wounded
2022 weekend tally: 4 killed, 22 wounded
2021 weekend tally: 7 killed, 23 wounded
2020 weekend tally: 1 killed, 21 wounded
2019 weekend tally: 3 killed, 14 wounded
2018 weekend tally: 5 killed, 17 wounded
2017 weekend tally: 8 killed, 16 wounded
2016 weekend tally: 5 killed, 26 wounded
2015 weekend tally: 6 killed, 28 wounded
Average tally: 5 killed, 19 wounded
Friday 3/20
8:40p 6800 S Ashland, Englewood, F/31
2 gunmen shoot motorist in River North
11:15p 400 W Ontario, Near North Side, M/26
Saturday 3/21
12:30a 2900 N Harlem, Montclare, M/57
3:00a 4300 S Wood, New City, M/48
11:55a 8100 S Drexel, Chatham, F/47
9:05p 200 E 38th, Douglas, M/39
9:05p 200 E 38th, Douglas, M/35
9:05p 200 E 38th, Douglas, M/?
11:00p 10100 S Princeton, Roseland, M/36
Sunday 3/22
12:10a 4500 S Wood, New City, M/42
12:30a 8000 S Hermitage, Auburn Gresham, M/?
2:15a 1300 S St Louis, North Lawndale, M/28
2:20a Walk-in @ Stitch-N-Go, M/43
3:00a Walk-in @ Stitch-N-Go, M/35
3:30a 5100 S Homan, Gage Park, M/22
7:30a 3000 W Lake, Garfield Park, M/41
3:00p 1300 S Western, North Lawndale, M/35
9:55a 6100 S Elizabeth, Englewood, M/31
5:20p 6900 S South Shore, South Shore, M/26
5:20p 6900 S South Shore, South Shore, M/?
5:20p 6900 S South Shore, South Shore, M/?
Wrong Place, Wrong Time Monday
Cancelled to work on new marketing material for “Chicago – Wrong Place, Wrong Time” campaign
Key:
shooting
homicide
Weekend = 12p Friday – 6a Monday
With St. Pat’s in the rearview mirror, it’s now time to get ready for Spring Training ahead of the annual Summer Shooting Season or better known as the Summer of Silly Decisions.
View all Enlightening Commentary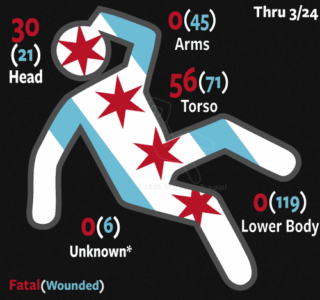
| Placement | Killed | Wounded |
|---|---|---|
| head | 18 | 9 |
| chest | 16 | 6 |
| abdomen | 5 | 20 |
| back | 5 | 16 |
| face | 5 | 7 |
| neck | 4 | 7 |
| side | 3 | 4 |
| other/unknown | 25 | 190 |
| As of 3/22/26 |
*Shot placement is not always reported. Chalkie shows general placement whereas the table shows exact placement by worst wound reported.
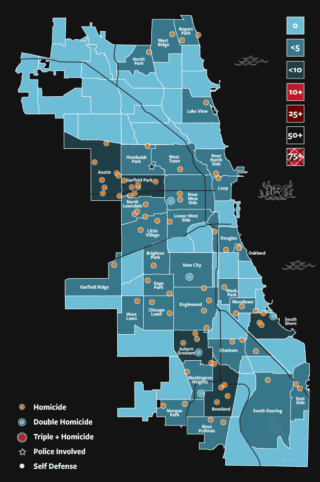
| N'hood | Homicides | Wounded |
|---|---|---|
| Austin | 8 | 26 |
| Englewood | 4 | 16 |
| South Shore | 5 | 13 |
| North Lawndale | 4 | 12 |
| Garfield Park | 7 | 8 |
| Auburn Gresham | 6 | 8 |
| Humboldt Park | 2 | 12 |
| New City | 2 | 11 |
| Roseland | 5 | 8 |
| Grand Crossing | - | 11 |
| Chatham | 2 | 8 |
| Woodlawn | 3 | 7 |
| Chicago Lawn | 2 | 7 |
| Near West Side | 4 | 4 |
| South Chicago | - | 8 |
| All Others | 35 | 100 |
| As of 3/22/26 |
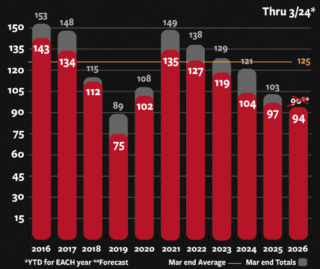
| Year | Homicides | Wounded |
|---|---|---|
| 2025 | 103 | 185 |
| 2024 | 121 | 419 |
| 2023 | 129 | 424 |
| 2022 | 138 | 503 |
| 2021 | 149 | 600 |
| 2020 | 108 | 433 |
| 2019 | 89 | 356 |
| 2018 | 115 | 433 |
| 2017 | 148 | 598 |
| 2016 | 153 | 683 |
Previous year data is reflective of current month-end totals.
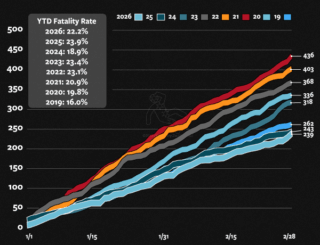
| Year | Killed | Wounded | Total | FR% |
|---|---|---|---|---|
| 2026 | 53 | 186 | 239 | 22.2% |
| 2025 | 58 | 185 | 243 | 23.9% |
| 2024 | 60 | 258 | 318 | 18.9% |
| 2023 | 86 | 282 | 368 | 23.4% |
| 2022 | 93 | 310 | 403 | 23.1% |
| 2021 | 91 | 345 | 436 | 20.9% |
| 2020 | 66 | 270 | 336 | 19.6% |
| 2019 | 42 | 220 | 262 | 16.0% |
| As of 3/1/26 | ||||
 Given Tuesday’s election results, it would appear as if we love our taxes. May we have another?
| Date | Killed | Wounded | FR% |
|---|---|---|---|
| 9/23/24 - 3/14/26 | 44 | 35 | 55.7% |
In conjunction with CWB Chicago’s “Brandon’s Bodies” series, the above illustrates Mayor Brandon Johnson’s decision to terminate the City’s relationship with ShotSpotter. Fatality rate (FR%) is total people fatally shot / total people shot.
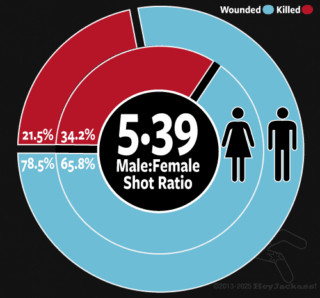
| Gender | Killed | Wounded |
|---|---|---|
| Male | 44 | 161 |
| Female | 13 | 25 |
| As of 2/28/26 |
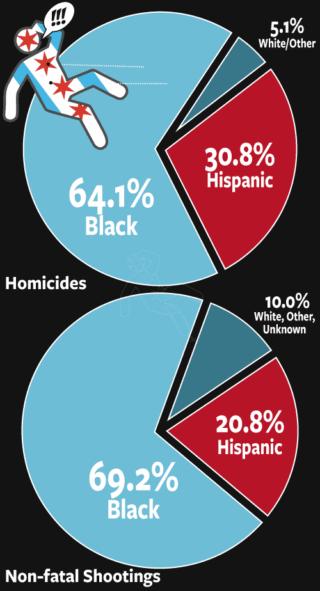
| Race | Killed | Wounded | Assailant |
|---|---|---|---|
| Black | 50 | 160 | 15 |
| Hispanic | 24 | 48 | 3 |
| White/Other | 4 | 7 | - |
| Unknown | - | 16 | - |
| As of 3/15/26 |
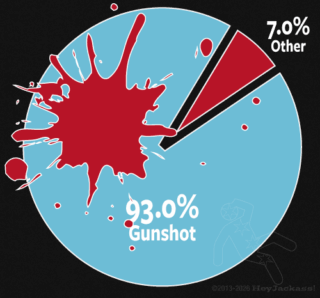
| Cause | Homicides | % |
|---|---|---|
| Gunshot | 53 | 93.0% |
| Trauma | 2 | 3.4% |
| Stabbing | 1 | 1.8% |
| Strangulation | 1 | 1.8% |
| As of 2/28/26 |
![]() As the old saying goes, “if the product is free, you’re the product” or maybe “you get what you pay for”. Either way, your free email isn’t free. Proton Mail is a quality email platform with an ad-free privacy bent where you’re not the product. This referral link helps pay for our email fees and in turn you’ll get a two week free trial and then $20 off if you subscribe. Thank you!
As the old saying goes, “if the product is free, you’re the product” or maybe “you get what you pay for”. Either way, your free email isn’t free. Proton Mail is a quality email platform with an ad-free privacy bent where you’re not the product. This referral link helps pay for our email fees and in turn you’ll get a two week free trial and then $20 off if you subscribe. Thank you!
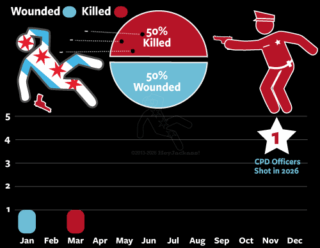
| Year | Killed | Wounded |
|---|---|---|
| 2026 | 1 | 1 |
| Previous Year Totals | ||
| 2025 | 8 | 14 |
| 2024 | 3 | 6 |
| 2023 | 5 | 5 |
| 2022 | 2 | 21 |
| 2021 | 9 | 13 |
| 2020 | 7 | 13 |
| 2019 | 6 | 6 |
| 2018 | 6 | 15 |
| 2017 | 11 | 12 |
| 2016 | 11 | 14 |
| 2015 | 9 | 16 |
| 2014 | 17 | 28 |
| 2013 | 13 | 30 |
| 2012 | 8 | 49 |
| 2011 | 23 | 37 |
| 2010 | 13 | 33 |
| 2009 | 19 | 42 |
| CPD Shot | - | 1 |
| Year | Killed | Wounded |
|---|---|---|
| 2026 | 1 | 1 |
| Previous Year Totals | ||
| 2025 | 4 | 9 |
| 2024 | 8 | 19 |
| 2023 | 8 | 15 |
| 2022 | 9 | 16 |
| 2021 | 5 | 7 |
| 2020 | 11 | 9 |
| 2019 | 6 | 9 |
| 2018 | 4 | 14 |
| 2017 | 13 | 8 |
| 2016 | 12 | 10 |
| 2015 | 5 | 3 |
| As of 3/21/26 | ||
 We’ve set up a Substack channel where we occasionally post longer form content that doesn’t necessarily work on the site. Subscribe if you like, or not. We spend most of our social media capital on Twitter/X. We sometimes post on Instagram which does little to help our official influencer status, but only if influencer means having no influence. We’ve also set up a TikTok account but rarely use it. Finally we have a toehold on a number of smaller, alternative social media platforms to be used primarily as “just-in-case” backups: Odysee, Rumble, Minds and GETTR.
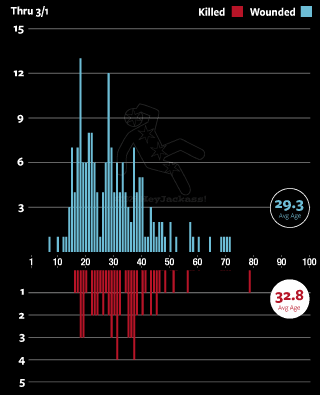
| Cohort | Killed | Wounded |
|---|---|---|
| Kids (0-12) | - | 3 |
| Teens (13-17) | 2 | 22 |
| Young Adults (18-35) | 34 | 108 |
| Middle Aged (36-54) | 20 | 39 |
| AARP (55+) | 2 | 9 |
| Unknown | - | 11 |
| As of 3/1/26 |

| Victims | Incidents | Killed |
|---|---|---|
| 4 shot | 1 | - |
| Hat Trick | 6 | 5 |
| 2 shot | 24 | 6 |
| As of 3/2/26 |
 Aside from the occasional live stream and videos some platforms find acceptable, most of our video content can now be found on Odysee. Warning: some of the images found within the Gallery may be graphic. View full Gallery
 You get a $10 credit and we get a little something as a finder’s fee, so go make something offensive. Looking for Chalkie or Mickey stickers in bulk, try our Stickermule store where you can load up by the 1000s.
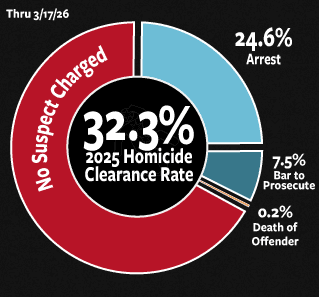
| Legal Outcome | Homicides | % |
|---|---|---|
| Total Homicides | 426 | 100% |
| No Suspect Charged | 288 | 67.6% |
| Suspect Charged | 105 | 24.6% |
| Bar to Prosecute | 32 | 7.5% |
| Death of Offender | 1 | 0.2% |
| As of 3/17/26 |
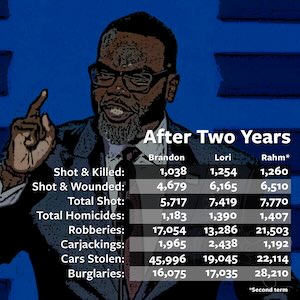
| Mayor | Term | Homicides |
|---|---|---|
| Richard J. Daley | 1955-1976 | 10,910 |
| Michael Bilandic | 1976-1979 | 2,408 |
| Jane Byrne | 1979-1983 | 3,202 |
| Harold Washington | 1983-1987 | 3,295 |
| Eugene Sawyer | 1987-1989 | 978 |
| Richard M. Daley | 1989-2011 | 14,653 |
| Rahm Emanuel | 2011-2019 | 4,535 |
| Lori Lightfoot | 2019-2023 | 2,958 |
| Brandon Johnson | 2023-Feb26 | 1,531 |
As more and more CPD frequencies move towards encryption, scanners are becoming useless. Check out CrimeIsDown’s Live Audio Feeds to listen to any zone that hasn’t been encrypted (yet) or use the official feeds with a 30+ minute delay on Broadcastify.
Sites we like.

As a small percentage of jagoffs ventilate one another with reckless abandon, we diligently record, document and illustrate every misconception, downward trending, mostly peaceful event. Your support in any amount is greatly appreciated.

 If you prefer crypto, we’ll gladly take it off your hands via our BTC address – bc1qrqhzj5fdlqevc9ltl22zajpn2zkxlcy32d99zj – or the QR code above.
We compile our own dataset using the following sources: Chicago Tribune, Chicago Sun-Times, Homicide Watch Chicago (no longer updated), DNAInfo Chicago (out of business), Chicago Redeye Homicide Tracker (long gone), NBC5 Chicago, Chicago Tribune’s Shooting Tracker (no longer updated) & Homicide Tracker (declared dead), Sun-Times Homicide Tracker, Cook County Medical Examiner, CPD’s Historical Data Set, City of Chicago Data Portal, Chicago Police Department Arrest Record Search, CPD CLEARMAP, Various CPD Dashboards, ISP Expressway Shooting Dashboard, CPD’s Media Major Incident Notifications and the needlessly woke Chicago Violence Reduction Dashboard.
Community areas and neighborhoods are determined by Crimeisdown.com’s most excellent Incident Map or the Chicago Tribune’s Boundaries App.
Editor’s note: All murders are homicides, but not all homicides are murders. We count homicides, whereas the CPD counts murders. A homicide, or a non-fatal shooting, regardless of type or by whom, within the city limits of Chicago counts towards our total metric, including anything on the expressways. CPD-involved, ISP-involved and justifiable homicides all count. Reckless homicides may count if the Medical Examiner rules that the cause of death was a homicide. Suicides do not count. Additional definitions can be found on the Glossary page.
All statistics, metrics, charts, graphs and other visualizations are preliminary based on the data available at the time. All incidents are subject to further analysis or change.