Customers who viewed this item also viewed
Buy New
-47%
$22.13$22.13
FREE delivery Sunday, May 10 on orders shipped by Amazon over $35
Advertisement
Advertisement
Ships from: Amazon Sold by: DAM Books USA
Another way to buy
-44%
$23.31$23.31
FREE delivery Sunday, May 10 on orders shipped by Amazon over $35
Advertisement
Advertisement
Ships from: Amazon.com Sold by: Amazon.com
Learn more
Add work books and access codes to your order
Used - Good
$17.98$17.98
FREE delivery May 13 - 15
Advertisement
Advertisement
Ships from: ThriftBooks-Chicago Sold by: ThriftBooks-Chicago
Add work books and access codes to your order
Sorry, there was a problem.
There was an error retrieving your Wish Lists. Please try again.Sorry, there was a problem.
List unavailable.
Download the free Kindle app and start reading Kindle books instantly on your smartphone, tablet, or computer - no Kindle device required.
Read instantly on your browser with Kindle for Web.
Using your mobile phone camera - scan the code below and download the Kindle app.
Follow the author
OK
Storytelling with Data: A Data Visualization Guide for Business Professionals 1st Edition
Purchase options and add-ons
International bestseller with over half a million copies sold. Don't simply show your data―tell a story with it!
Storytelling with Data teaches you the fundamentals of data visualization and how to communicate effectively with data. You'll discover the power of storytelling and the way to make data a pivotal point in your story. The lessons in this illuminative text are grounded in theory, but made accessible through numerous real-world examples―ready for immediate application to your next graph or presentation.
Storytelling is not an inherent skill, especially when it comes to data visualization, and the tools at our disposal don't make it any easier. This book demonstrates how to go beyond conventional tools to reach the root of your data, and how to use your data to create an engaging, informative, compelling story.
Specifically, you'll learn how to:
- Understand the importance of context and audience
- Determine the appropriate type of graph for your situation
- Recognize and eliminate the clutter clouding your information
- Direct your audience's attention to the most important parts of your data
- Think like a designer and utilize concepts of design in data visualization
- Leverage the power of storytelling to help your message resonate with your audience
Together, the lessons in this book will help you turn your data into high impact visual stories that stick with your audience. Rid your world of ineffective graphs, one exploding 3D pie chart at a time. There is a story in your data―Storytelling with Data will give you the skills and power to tell it.
- ISBN-101119002257
- ISBN-13978-1119002253
- Edition1st
- PublisherWiley
- Publication dateNovember 2, 2015
- LanguageEnglish
- Dimensions7.2 x 0.8 x 9.1 inches
- Print length288 pages
Frequently bought together
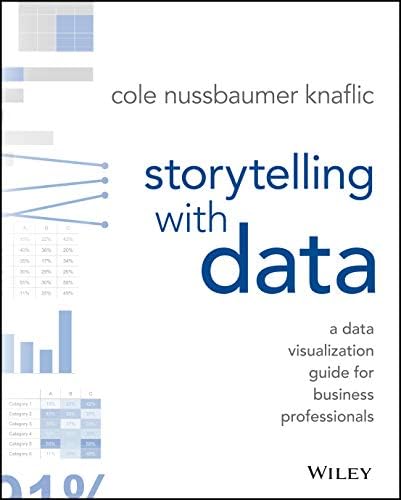
Deals on related products
Customers also bought or read
- The Big Book of Dashboards: Visualizing Your Data Using Real-World Business Scenarios
Paperback$28.99$28.99Delivery Sun, May 10 - Better Data Visualizations: A Guide for Scholars, Researchers, and Wonks
Paperback$21.99$21.99Delivery Sun, May 10 - Data Science for Business: What You Need to Know about Data Mining and Data-Analytic Thinking
Paperback$26.00$26.00Delivery May 12 - 13 - Information Dashboard Design: Displaying Data for At-a-Glance Monitoring
Hardcover$23.43$23.43Delivery Sun, May 10 - The Tableau Workshop: A practical guide to the art of data visualization with Tableau
Paperback$48.99$48.99FREE delivery Sun, May 10 - Avoiding Data Pitfalls: How to Steer Clear of Common Blunders When Working with Data and Presenting Analysis and Visualizations
Paperback$26.99$26.99Delivery Sun, May 10 - Effective Data Storytelling: How to Drive Change with Data, Narrative and Visuals
Hardcover$22.49$22.49Delivery Sun, May 10 - Show Me the Numbers: Designing Tables and Graphs to Enlighten
Hardcover$22.57$22.57Delivery May 14 - 15 - The Visual Display of Quantitative Information, 2nd Ed.#1 Best SellerMathematical Analysis
Hardcover$22.78$22.78FREE delivery May 12 - 18 - Becoming a Data Head: How to Think, Speak, and Understand Data Science, Statistics, and Machine Learning#1 Best SellerData Mining
Paperback$22.20$22.20Delivery May 15 - 17 - Visualize This: The FlowingData Guide to Design, Visualization, and Statistics
Paperback$21.40$21.40Delivery Sun, May 10 - Fundamentals of Data Visualization: A Primer on Making Informative and Compelling Figures
Paperback$47.00$47.00FREE delivery Sun, May 10 - Practical Statistics for Data Scientists: 50+ Essential Concepts Using R and Python
Paperback$40.25$40.25FREE delivery Sun, May 10 - SQL for Data Analysis: Advanced Techniques for Transforming Data into Insights
Paperback$36.49$36.49FREE delivery Sun, May 10 - Be Data Literate: The Data Literacy Skills Everyone Needs To Succeed
Paperback$24.61$24.61Delivery Mon, May 11 - The Wall Street Journal Guide to Information Graphics: The Dos and Don'ts of Presenting Data, Facts, and Figures
Paperback$19.68$19.68Delivery Sun, May 10 - Dashboards That Deliver: How to Design, Develop, and Deploy Dashboards That Work
Paperback$18.10$18.10Delivery Sun, May 10 - Good Charts, Updated and Expanded: The HBR Guide to Making Smarter, More Persuasive Data Visualizations
Paperback$24.87$24.87Delivery Sun, May 10 - Python for Data Analysis: Data Wrangling with pandas, NumPy, and Jupyter
Paperback$43.99$43.99FREE delivery Sun, May 10 - Data Analytics Essentials You Always Wanted To Know : A Practical Guide to Data Analysis Tools and Techniques, Big Data, and Real-World Application for Beginners
Paperback$38.99$38.99FREE delivery Sun, May 10 - Data Visualization with Microsoft Power BI: How to Design Savvy Dashboards
Paperback$41.33$41.33FREE delivery Sun, May 10 - Practical SQL, 2nd Edition: A Beginner's Guide to Storytelling with Data
Paperback$21.49$21.49Delivery Sun, May 10
From the brand
-
Cole Nussbaumer Knaflic
Cole Nussbaumer Knaflic is the founder and CEO of Storytelling with Data and author of five bestselling books on the topic. For over a decade, she and her team have helped individuals and organizations around the world create clear, effective visualizations and tell compelling data stories that drive change. She shares her expertise through the SWD community, blog, podcast, videos, and interactive learning experiences.
-
Featured Titles
From the Publisher
Editorial Reviews
Review
"Storytelling with Data is a superbly written, masterful display of rare art in the business world." - Mark R. Hillis, Chief Risk Officer of Mortgage Banking at JPMC
"My team is already using the lessons Cole teaches to move people to action as they see new pearls of understanding and make a difference in the lives of others. Now others can, too!" - Eleanor Bell, Director of Business Analytics at Bill & Melinda Gates Foundation
"If you are a beginner in visualization, or if you struggle to produce good charts in your everyday job with tools like Excel, Tableau, Qlik, and the like, this is a great place to start learning the core principles." - Alberto Cairo, Knight Chair in Visual Journalism and Professor of Visualization at the University of Miami, and author of The Functional Art
"Cole Nussbaumer Knaflic has written a straightforward, accessible guide that will help anyone who communicates with data connect more effectively with their audience." - Nancy Duarte, CEO at Duarte, Inc. and bestselling author
From the Inside Flap
"Storytelling with Data is a superbly written, masterful display of rare art in the business world. Cole Nussbaumer Knaflic possesses a unique ability—a gift—in telling a story through data. At JPMorgan Chase, she has helped improve our capabilities to explain complicated analysis to executive management and the regulators with whom we work. Cole's book brings her talents together in an easy-to-read guide with excellent examples that anyone can learn from to encourage smarter decision-making."
- Mark R. Hillis, Chief Risk Officer of Mortgage Banking at JPMorgan Chase
"We have so much data that it can be hard to get people to pay attention to our critical findings. Cole Nussbaumer Knaflic taught us valuable lessons in her workshop and it is fantastic to see these expanded upon in Storytelling with Data. My team is already using the lessons Cole teaches to move people to action as they see new pearls of understanding and make a difference in the lives of others. Now others can, too!"
- Eleanor Bell, Director of Business Analytics at Bill & Melinda Gates Foundation
"There is something lovely about being consistent with your own teachings. Cole Nussbaumer Knaflic accomplishes that with her first book. She is an advocate for clarity and concision in visualization, and her book is as clear, concise, and practical as it gets. If you are a beginner in visualization, or if you struggle to produce good charts in your everyday job with tools like Excel, Tableau, Qlik, and the like, this is a great place to start learning the core principles."
- Alberto Cairo, Knight Chair in Visual Journalism and Professor of Visualization at the University of Miami, and author of The Functional Art
"Data slides are not really about the data, they are about the meaning of the data. Cole Nussbaumer Knaflic understands this and has written a straightforward, accessible guide that will help anyone who communicates with data connect more effectively with their audience."
- Nancy Duarte, CEO at Duarte, Inc. and bestselling author
From the Back Cover
praise for storytelling with data
"Storytelling with Data is a superbly written, masterful display of rare art in the business world. Cole Nussbaumer Knaflic possesses a unique ability―a gift―in telling a story through data. At JPMorgan Chase, she has helped improve our capabilities to explain complicated analysis to executive management and the regulators with whom we work. Cole's book brings her talents together in an easy-to-read guide with excellent examples that anyone can learn from to encourage smarter decision-making."
―Mark R. Hillis, Chief Risk Officer of Mortgage Banking at JPM Chase
"We have so much data that it can be hard to get people to pay attention to our critical findings. Cole Nussbaumer Knaflic taught us valuable lessons in her workshop and it is fantastic to see these expanded upon in Storytelling with Data. My team is already using the lessons Cole teaches to move people to action as they see new pearls of understanding and make a difference in the lives of others. Now others can, too!"
―Eleanor Bell, Director of Business Analytics at Bill & Melinda Gates Foundation
"There is something lovely about being consistent with your own teachings. Cole Nussbaumer Knaflic accomplishes that with her first book. She is an advocate for clarity and concision in visualization, and her book is as clear, concise, and practical as it gets. If you are a beginner in visualization, or if you struggle to produce good charts in your everyday job with tools like Excel, Tableau, Qlik, and the like, this is a great place to start learning the core principles."
―Alberto Cairo, Knight Chair in Visual Journalism and Professor of Visualization at the University of Miami, and author of The Functional Art
"Data slides are not really about the data, they are about the meaning of the data. Cole Nussbaumer Knaflic understands this and has written a straightforward, accessible guide that will help anyone who communicates with data connect more effectively with their audience."
―Nancy Duarte, CEO at Duarte, Inc. and bestselling author
About the Author
For nearly a decade, Cole and team have delivered interactive learning sessions highly sought after by data-minded individuals, companies, and philanthropic organizations all over the world. They also help people create graphs that make sense and weave them into a compelling story through the popular SWD blog, podcast, monthly challenge, and live stream events and other resources. Learn more at storytellingwithdata.com.
Product details
- Publisher : Wiley
- Publication date : November 2, 2015
- Edition : 1st
- Language : English
- Print length : 288 pages
- ISBN-10 : 1119002257
- ISBN-13 : 978-1119002253
- Item Weight : 2.31 pounds
- Dimensions : 7.2 x 0.8 x 9.1 inches
- Best Sellers Rank: #9,995 in Books (See Top 100 in Books)
- Customer Reviews:
About the author

Cole Nussbaumer Knaflic tells stories with data. She is founder and CEO of storytelling with data (SWD) and author of Storytelling With Data: A Data Visualization Guide for Business Professionals and Storytelling with Data: Let's Practice! SWD's well-regarded workshops and presentations are highly sought after by data-minded individuals, companies, and philanthropic organizations all over the world. Learn more at storytellingwithdata.com.
Related products with free delivery on eligible orders
Customer reviews
Customer Reviews, including Product Star Ratings help customers to learn more about the product and decide whether it is the right product for them.
To calculate the overall star rating and percentage breakdown by star, we don’t use a simple average. Instead, our system considers things like how recent a review is and if the reviewer bought the item on Amazon. It also analyzed reviews to verify trustworthiness.
Learn more how customers reviews work on AmazonCustomers say
Generated from the text of customer reviewsSelect to learn more
Reviews with images
Buy this book if you want to immediately 'level up' your data viz skills
Top reviews from the United States
- 5 out of 5 stars
A go-to reference book for data visualization
Reviewed in the United States on October 30, 2025I have used this book for years as a go-to reference when I am designing visualizations that need to convey specific and targeted information effectively. It's a practical book, and easy to navigate quickly to sections that relate to what you are trying to accomplish. It's definitely worth reading through from the beginning, as a reminder of the importance of identifying audience and context before you design anything. I would recommend as a core reference book for anyone who has to regularly create visuals from data in order to get an audience into context so they can make informed decisions.
2 people found this helpfulSending feedback...Sending feedback...HelpfulThank you for your feedback.Sorry, we failed to record your vote. Please try againThanks, we'll investigate in the next few days.Sorry, We failed to report this review. Please try again - 5 out of 5 stars
Fantastic writing on how to build sets of images
Reviewed in the United States on September 17, 2017I am a university professor who teaches biostatistics and I find this to be one of the best books that bridges the gap between analytics and presentation. There are some excellent books around that show visualization (e.g., The Wall Street Journal Guide to Information Graphics: The Dos and Don'ts of Presenting Data, Facts, and Figures or books by Few Information Dashboard Design: Displaying Data for At-a-Glance Monitoring & Show Me the Numbers: Designing Tables and Graphs to Enlighten or Cairo The Truthful Art: Data, Charts, and Maps for Communication) and there are good books on presentation (in particular I love Duarte's books Resonate: Present Visual Stories that Transform Audiences) but this book is unique in how well it blends the two topics. I have never seen such an excellent presentation on how to build a series of graphics. That is, with books by Few or Cairo you will know how to make *a* great graphic and with advice from Duarte, you can connect with your audience but with this book you will see how to build a series of interrelated graphics that highlight different parts of a dataset. Most of the examples are spun around business but the examples are easy to extend to any field.
While I think the author wrote this for people who do presentations in any quantitative field for a living, this book should be required reading for graduate students preparing to defend a dissertation or thesis.
293 people found this helpfulSending feedback...Sending feedback...HelpfulThank you for your feedback.Sorry, we failed to record your vote. Please try againThanks, we'll investigate in the next few days.Sorry, We failed to report this review. Please try again - 4 out of 5 stars
Loved this book. Demystified working with data
Reviewed in the United States on March 26, 2026I no longer feel I just need to show a bunch of slides to make an effective presentation rather, I can think through a coherent story that I want the slides to represent. Love this book
Sending feedback...Sending feedback...HelpfulThank you for your feedback.Sorry, we failed to record your vote. Please try againThanks, we'll investigate in the next few days.Sorry, We failed to report this review. Please try again - 5 out of 5 stars
Game Changer
Reviewed in the United States on July 2, 2025This is a must read for anyone creating data visualization. It provides clear, succinct examples and explains why one approach is better than other and is loaded with example visuals. This is a great reference for any person or data team to better enhance their storytelling with data. There aren’t enough encouraging words to express what a game changer this book is.
One person found this helpfulSending feedback...Sending feedback...HelpfulThank you for your feedback.Sorry, we failed to record your vote. Please try againThanks, we'll investigate in the next few days.Sorry, We failed to report this review. Please try again - 5 out of 5 stars
Full of both insight and practical advice
Reviewed in the United States on June 10, 2025This book gives both an overall framework for thinking about data visualization and a toolkit for designing the most common types of visualizations. Each type of visualization is presented with insights and practical tips. The book presents all of this material and detail concisely. Well worth a read and occasional review.
Sending feedback...Sending feedback...HelpfulThank you for your feedback.Sorry, we failed to record your vote. Please try againThanks, we'll investigate in the next few days.Sorry, We failed to report this review. Please try again - 5 out of 5 stars
Level-up your data presentation game
Reviewed in the United States on March 2, 2019An inspiring quick read to help break free of the tyranny of Excel's default chart styles. The book is packed with practical advice aimed at making your charts and accompanying stories more visually pleasing and impactful. There are many "before and after" examples with explanations of the "why" beyond the suggested improvements. The book provides a good foundation for the reader to then build upon with more advanced books covering (for example) interactive dashboards and the technical details of using various dedicated software data visualization tools -- topics that this book doesn't touch.
After reading some of the negative reviews I almost didn't purchase the book; however, I took the chance based on the quality of the author's blog and podcast. Rereading these reviews now, the complaints regarding poor print and binding are likely from a since-resolved bootleg copy issue that the author mentioned in September 2018 a Data Stories podcast. Regarding being too basic, I can only say that I learned some valuable lessons even after several decades in the corporate world using Excel and PowerPoint and also recently completing an online course for how to use Tableau. If you are still debating purchase, do as I did and read some of the Storytelling With Data blog and then decide.
11 people found this helpfulSending feedback...Sending feedback...HelpfulThank you for your feedback.Sorry, we failed to record your vote. Please try againThanks, we'll investigate in the next few days.Sorry, We failed to report this review. Please try again - 5 out of 5 stars
Clear, concise, useful, and highly recommended!
Reviewed in the United States on November 5, 2015Cole takes a difficult subject and makes it understandable. By itself that would be good and worthy of praise. Clarity is always appreciated. But she does this by employing the skills, traits, and tricks that she so clearly explains. Cole implores the reader to eliminate clutter, visually demonstrates why it is important and its potential impact, then strips away at difficult concepts with clear and concise prose again and again. We readily grasp all this because of her use of context, visual display, simplicity, focus, design, and in so doing she tells a story about dealing with data and information, so that we can inform and not confuse. Perfect. But she achieves even more because through the use of these concepts she makes them useful for everyone and not only those dealing with large data sets; she demonstrates that which she illustrates. I'm a trial lawyer. I found her chapters on thinking like a designer and lessons in storytelling to be more than helpful. From the importance of aesthetics, audience, controlling narrative flow, to repetition she provides lessons in telling stories that can benefit anyone. Recommended for everyone!
22 people found this helpfulSending feedback...Sending feedback...HelpfulThank you for your feedback.Sorry, we failed to record your vote. Please try againThanks, we'll investigate in the next few days.Sorry, We failed to report this review. Please try again - 3 out of 5 stars
Great overview, a little stretched at times
Reviewed in the United States on November 8, 2025Learned a lot from the book but think it could be half as long. Would still recommend anyone interested in the topic to read it!
Sending feedback...Sending feedback...HelpfulThank you for your feedback.Sorry, we failed to record your vote. Please try againThanks, we'll investigate in the next few days.Sorry, We failed to report this review. Please try again
Top reviews from other countries
natcaste5 out of 5 starsGreat book, an absolute must have for every analyst
Reviewed in France on June 18, 2019This book is really useful, it brings a lot of topics in a clear and easy way.
Sending feedback...Thanks, we'll investigate in the next few days.Sorry, We failed to report this review. Please try again
Abdulkarim Zakaria4 out of 5 starsSave your money
Reviewed in Saudi Arabia on April 2, 2026The book offers excellent visualization advice, but it comes at a steep price.
Sending feedback...Thanks, we'll investigate in the next few days.Sorry, We failed to report this review. Please try again
Rafeh5 out of 5 starsVery useful
Reviewed in the United Arab Emirates on October 31, 2023A guide for all business professionals. Easy to read and has great examples. 10/10 recommended.
Sending feedback...Thanks, we'll investigate in the next few days.Sorry, We failed to report this review. Please try again
Jamie and Jake's Dad5 out of 5 starsAmazingly clear, engaging and intelligent book that will change how you present data
Reviewed in the United Kingdom on January 25, 2026I chose this book as part of my study for the BCS Data Visualisation Foundation Award and partly as a Product Manager to improve my presentation of how our system's value will be/has been impacted by developments. Everything about this book is clear from the chapter structure to the way every point of improvement is illustrated on the page.
Cole knows her stuff - she refers a book by Stephen Few, who I have previously found to be the single most helpful source of advice on charts. Modern tools like Powerpoint boast "AI Design suggestions" which look great but the simple guidelines here, if followed, simply blow away the AI'd output. It's a timely book and should be compulsory study for presenters and managers.
Within the first 3 days I had read 50 pages and enhanced my Product Values dashboard to something better than I thought possible but it was soo simple.
It is very competitively priced as well
Sending feedback...Thanks, we'll investigate in the next few days.Sorry, We failed to report this review. Please try again
Nic I. am5 out of 5 starsElogio della semplicità
Reviewed in Italy on November 28, 2017i moderni strumenti informatici ci mettono a disposizione delle applicazioni molto interessanti per poter creare grafici e tabelle per la presentazione dei dati. Ma la cosa più importante da capire é come conformare questo grafici per fare in modo che il nostro interlocutore comprenda il senso del messaggio che si vuole trasmettere.
Da questo punto di vista l’autrice ha le idee molto chiare e porta letteralmente per mano il lettore nelle varie strategie di conformazione dei dati per rendere evidente la parte realmente importante da trasmettere all’interlocutore.
In un certo senso é come parlare di “Lean Method” per la comunicazione di grafici e dati.
Un testo sicuramente illuminante ed istruttivo sull’argomento.
Dopo averne letto i contenuti, se nella vostra attività vi troverete ad assistere a presentazioni di analisi di dati o, se dovrete farle voi, avrete sicuramente un approccio differente alla modalità di presentazione.
Una lettura piacevole e molto chiara
Sending feedback...Thanks, we'll investigate in the next few days.Sorry, We failed to report this review. Please try again


