The Federal Energy Regulatory Commission (FERC) collects a lot of data in its role as the regulator of US electricity markets. One dataset that we’ve had our eyes on for years, but never had the resources to integrate into PUDL (until now!) is the Electric Quarterly Report or EQR.
The EQR is the reporting mechanism FERC uses for public utilities to fulfill their responsibility under section 205(c) of the Federal Power Act (FPA) to have their rates and charges on file in a convenient form and place.
Under this section of the FPA:
Where two or more public utilities are parties to the same rate schedule or tariff, each public utility transmitting or selling electric energy subject to the jurisdiction of this Commission shall post and file such rate schedule
In modern US electricity markets, there’s more than a million of these transactions every day. This makes posting them in a “convenient form and place” non-trivial. FERC provides an online EQR report viewer where you can scroll through a list of thousands of sellers and download their filing for a particular quarter as a summary PDF. But this is no way to do analysis.
They also offer bulk downloads of the raw data as quarterly zipfiles containing CSVs or XML documents, but with more than 4 billion transactions recorded since the modern reporting era started in 2013, these formats are also not very ergonomic for bulk analysis. And even as compressed zipfiles, the full FERC EQR dataset is 100 GB. It’s far too big analyze in bulk locally with tools like pandas, let alone spreadsheets. However, with the development of tools like DuckDB and Polars over the last few years, working with this scale of tabular data has become much easier — even on a laptop!
The data locked up in the FERC EQR is potentially valuable for understanding how renewable energy power purchase agreements and battery storage prices have evolved over time, and what’s really driving rising energy costs. The EQR data is particularly valuable for less organized markets like the US Southeast and Intermountain West, where there is no ISO/RTO market data. We’re hopeful that this data can also make it easier to programmatically identify anti-competitive utility affiliate transactions and uneconomic self-dispatch by regulated monopolies.
Democratizing FERC EQR Access
With additional support from Gigawatt-tier PUDL SustainerGridLab, Catalyst is going to create an open access, cloud-native version of the FERC EQR dataset, designed for bulk analysis.
Timeframe: We expect to be working on the project from now through the first quarter of 2026.
Data Coverage: We are initially targeting the 2013Q3 to present data, since it is all in a very similar format, while older EQR data was submitted under a different reporting regime, in a different format, and is also not as rich in detail (though we have already archived the raw 2002-2013 data).
Outputs: We’re planning to mirror the structure of the current data, with four main tables: transactions, contracts, filer identities, and index publications, along with a new table that records all FERC company IDs and tracks how their reported name and other attributes change over time.
Format: The data will be distributed as a collection of Apache Parquet files, probably partitioned by quarter. All of the data from 2013Q3 to the present will use the same well-defined schema, informed by all of the historical EQR data dictionaries published by FERC.
Processing: Our first priority is making the bulk data freely accessible in a format that’s appropriate for analysis. We are not planning on doing any major data processing, beyond enforcing a uniform schema, converting the data to Parquet, and dealing with character encoding and CSV formatting issues that affect ~1% of all records.
Versioning: Due to the size of the data and the limited free cloud storage we have as part of the AWS Open Data Registry we won’t be able to provide multiple historical versions of the outputs like we do with other PUDL data. Whenever we update the outputs, the older version will be replaced.
Updates: We plan to update the outputs at least once a quarter, and will capture fresh snapshots of the raw EQR data using our automated data archiving scripts.
Access: We plan to publish the FERC EQR alongside the rest of our PUDL data in a freely accessible S3 bucket as part of the AWS Open Data Registry. We also intend to make the EQR outputs available for preview and querying through the PUDL Data Viewer, which will allow users to download smaller subsets of the data as CSVs for spreadsheet-based analysis if that’s what they need.
Get Involved!
If you’re already familiar with the FERC EQR and want to help test out the new data we’d love to hear from you: [email protected]
We’d like to better understand how this data is used in any context, whether it’s research, policy, journalistic, or commercial, so if you’ve got a use case in mind for historical electricity transaction data, let us know what it is. Maybe sign up for office hours so we can chat more, or help you get familiar with Parquet files.
What other data does the FERC EQR need be connected to? One of the things we’re hoping this analysis-ready, cloud-native version of EQR will enable is robust record linkage with other datasets. Can we identify the LMP nodes where power is being delivered? Can we identify electricity buyers in other FERC or EIA data, even though all we have is their name? What else should we be thinking about?
Stay up to date with the project: Subscribe to our ~monthly newsletter, keep track of the FERC EQR issues in the main PUDL repo, or follow the EQR scoping repo where we’ll be prototyping the new system.
After 5 years of ogling the EQR from afar, and projecting our (data) hopes and dreams into its depths, we’re excited to finally tackle it for real, and hope it’ll be a valuable resource for understanding US energy markets and accelerating the ever more economical decarbonization of the US electricity system.
Last July we conducted more than 60 interviews with energy data users to kick-off our work for the NSF POSE grant! While that process was very informative, it was also a huge amount of work, and we also want to have more sustainable ways to understand the needs of energy data users (PUDL or otherwise).
So this winter, we put out our first annual Energy Data Ecosystem Survey—a short, mostly multiple-choice questionnaire built on insights from our conversations. 47 of you responded, and we learned a lot!
Before we dig into the results, we’ve made a few other changes in the wake of talking to you all:
One of our core takeaways from the interviews was how organizations struggle with technical skill building and capacity. This is something Catalyst can address with our consulting services and educational content creation. Thanks to funding from the Sloan Foundation, we’ve developed OpenEnergyData4All, a training series to help future and current energy data users gain more confidence in their technical skills. We’re excited to continue creating content like this to help people engage more readily with the data!
Another important theme was users’ desire for data that is easy to explore. A large portion of technical and non technical users relied heavily on our PUDL browser viewing tool, Datasette. While Datasette was simple for us to set up and enabled users to explore PUDL data on the web and download CSV’s, it isn’t really designed to handle the scale of data that we’re publishing now. We developed a Beta PUDL Viewer for technical and non technical users to interact with and search through the data with greater ease. We’re continuing to improve the tool, so be sure to leave any feedback or ideas here.
Now, the Ecosystem Survey. The TL;DR:
It’s difficult to find the right data to answer your questions, and PUDL is no exception. We need to make it easier for folks to find what they’re looking for and parse through our extensive data catalog. We’re excited about the new PUDL data viewer, but there’s more we can do to make PUDL more useful and less overwhelming.
We did a good job picking the most important datasets to pull into PUDL! Generally speaking the data that are used most often are the ones we’ve integrated (pats self on the back), though there was undoubtedly some bias in who took the survey.
Energy data users have more Python and open source contribution experience than we thought! This combined with the fact that most energy data users have at some point written down quirks about the data tells us that we need to make contributing to PUDL easier and more desirable.
Now here’s a deeper dive on the state of energy data according to you:
Who are you?
You’re mostly academics and educators, but you represent a wide range of organization types including NGOs, for-profits, and hobbyists. A smaller subset of you represent folks working directly in policy, utility regulation, or for utilities themselves. Notably, none of you are journalists.
The primary outputs of your work are peer reviewed publications, data visualizations, and reports.
This is not entirely surprising as most of the grants we’ve received prioritize building better teaching and research tools for the academic community. Many of our datasets also contain long, historic time series which cater more to academic research than something like real-time market data might to the private sector. We’re excited to continue serving these communities and hope to engage more readily with university labs moving forward. If that’s you, let’s get in touch!
Knowing that researchers make up the bulk of energy data users also helps us prioritize things like clear methodologies that we know are important to them.
Utilities rank low likely because they use their own data and don’t rely as much on public or commercial sources of information. National Labs, on the other hand, are definitely using energy data–their lower ranking might be an artifact of our network or outreach strategy.
All org types in the bottom half of the ranking are ones whose data use we want to better understand.
What are you using energy data for?
You primarily use this data for utility or facility level financial and economic modeling, but you’re also quite involved in developing new policy proposals, energy system models, regulatory interventions, and spreading awareness about the climate and its impact on the grid.
It makes sense that the primary use for energy data is modeling. Luckily we already sniffed this one out and are working closely with GridLab to make our outputs as model-ready as possible. We’re considering things like making a set of standard inputs for the most common models and removing any usage barriers that modelers have with PUDL. If you’re a modeler with ideas about how to make PUDL data better, reach out!
While policymakers may not be the ones using the data, the data is affecting policy in the venues that count! We are interested in understanding the full diversity of uses for this data, so whether you think you are doing something groundbreaking, niche, or utterly everyday, write and tell us about it! We want to know the full data-to-impact story.
What data are you using the most?
The most sought after datasets tend to be those already integrated into PUDL: EIA 860, EIA 923, EIA 861, NREL ATB, and FERC Form 1. Many of you also rely on data that is not yet (fully) integrated into PUDL: Weather data, EIA AEO, NREL EFS, NREL ResStock, ISO/RTO data, Census, and EPA eGrid data.
Our survey included many PUDL users, so it’s not shocking that the datasets they value most are already available in PUDL. Still, it’s encouraging to see respondents’ priorities align with our core offerings. This suggests that we’ve chosen high-impact datasets and can focus more time and energy on improving them.
Identifying which non-PUDL datasets matter is equally important. It helps us prioritize future integration efforts and make a stronger case for funding them. Some of these datasets are already archived on our Zenodo and would be relatively straightforward to incorporate (e.g., EIA AEO, eGRID, NREL EFS). Others are more complex. Here’s how we’re thinking about the trickier ones:
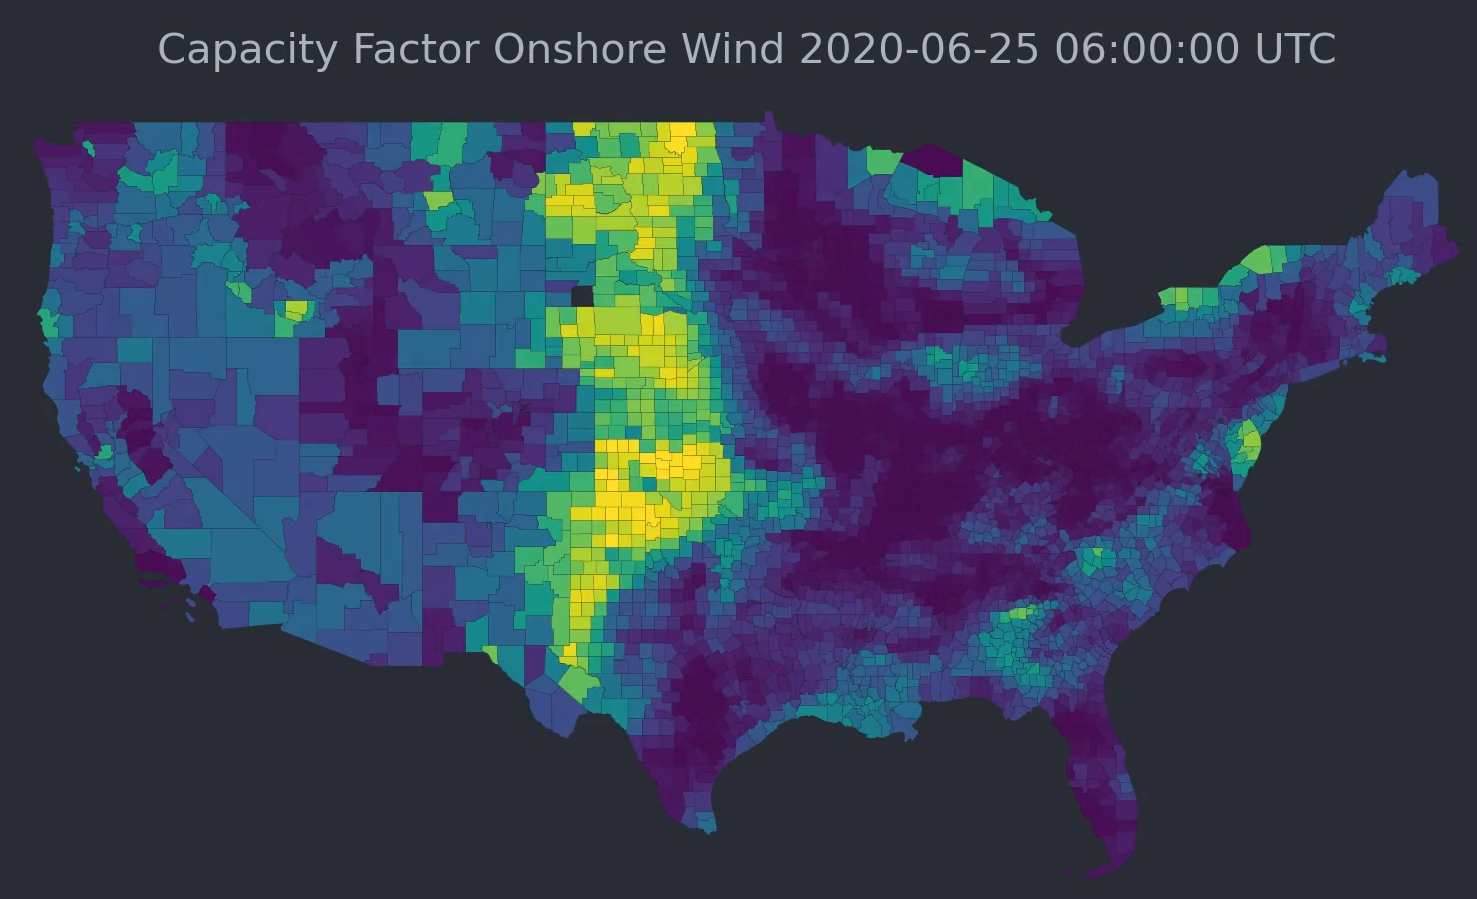
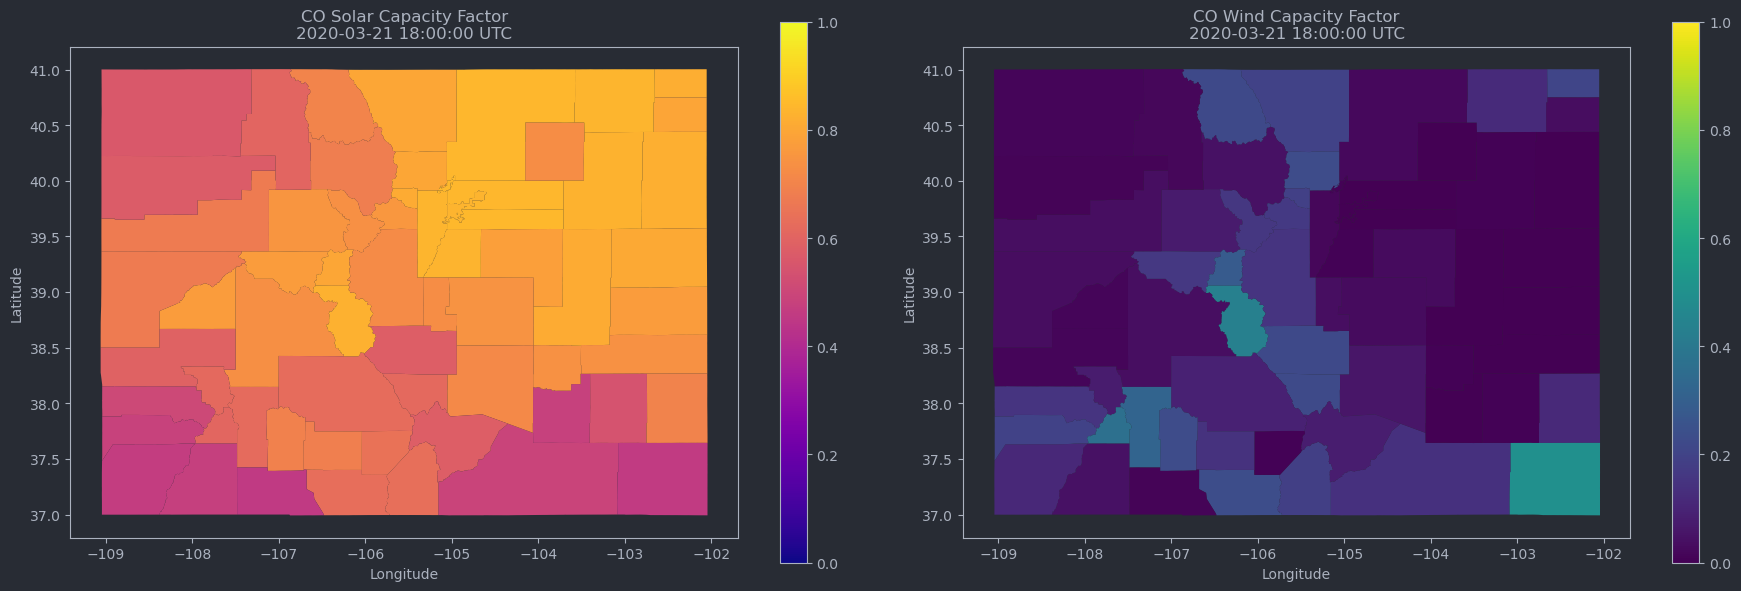
Generally speaking, weather data from sources like NOAA, NASA, and NWS is a lot cleaner and more readily accessible than some of the other data we work with, so the need for a clean copy is less urgent. It’s also much larger and typically structured as a gridded multi-dimensional array, rather than a database table, making it more complicated to integrate into PUDL. Moreover, weather data is a bit outside our purview–we’re not as confident cleaning, transforming, and explaining it as we are energy system data.
It might make sense for us to collaborate with modelers or an organization with domain expertise to help build a bridge between big weather data and energy system model inputs. However, there’s been a fair amount of research in this vein, and gaps or granularity issues in the underlying data seem to be more of a barrier than data access itself. Check out atlite and renewables.ninja for relevant work.
ISO/RTO data is not a product of the federal government, so it’s subject to a set of unique licensing and usage constraints that we’d have to examine more closely before republishing. Extracting and synchronizing data from RTO/ISOs is also non-trivial given the real-time nature of the data and the fact that each ISO/RTO is an independent organization that handles data differently. Grid Status has this covered.
NREL ResStock is interesting but for now too large to archive on Zenodo.
If you’re using any of these non-PUDL datasets, let us know how we could help make them more accessible. What sort of format or tables are most useful to you?
How do you choose and obtain data?
72% of you access data by downloading it directly from federal and state agencies. Unsurprisingly (it’s our survey after all) 60% of you are PUDL users too. A smaller, but not insubstantial portion (33%) of you endeavor to get data directly from utilities and/or the various RTOs/ISOs.
When choosing a dataset, 72% of you also indicated that clear data processing methodology is important. Other considerations include data sharability, format, and update cadence. These factors were cited more frequently than things like data resolution or completeness.
The big takeaway here is that users are more likely to get data straight from the source than curated, often costly platforms like S&P, Hitachi, or Yes Energy, even if that means doing a little (or a lot) of cleaning themselves. We can harness all this knowledge by giving people more opportunities to share their experiences working with these raw datasets and incorporating that information into PUDL.
This also serves as an important reminder that just because our code is open source does not mean that our methodologies are clear and transparent. In order to build trust with users, we need to make sure that PUDL does an adequate job of explaining how the data are processed. This is something we care deeply about and have discussed at length. There are many different ways to share data transformation methodologies, and we want to make sure our approach is both intelligible and readily maintained. This topic could be a whole new blog (and hopefully will be eventually). For right now, we’re aiming to bolster our documentation so it’s easier to navigate and understand what is going on!
How do you work with data?
The majority of you rely heavily on Python (81%) to process your data. Excel and R are tied, followed by SQL and others.
CSV, Parquet, and JSON are your most desired data formats, in that order. PDF and XML/XBRL shared a spot at the bottom with 0 votes.
Most of you have written down quirks about the data you are working with or made visualizations to accompany your work with PUDL data. As noted above, a decent chunk of you have also had to contend with data not yet available through PUDL, thus extracting and transforming it on your own. Very few folks have tried to incorporate this work into PUDL. However, nearly half of you have experience creating GitHub issues or even writing pull requests to change source code.
This further confirms our desire to improve the PUDL contribution process! We want to provide people with venues to share their knowledge about the data, not just write code. Our current idea is to build an energy data wiki that anyone could contribute to. This would help lower the barrier to entry for compiling qualitative information about the data.
What are your pain points when using energy data?
Nearly half of you struggle to find the right data to answer your questions, extract data from difficult formats (like PDFs), and connect data from disparate datasets with no common identifiers.
With regard to PUDL specifically, you aptly noted that we publish multiple versions of the same data without enough documentation to let users identify which version is right for their use case. For the amount of information in PUDL, you also noted that our docs are confusing and sometimes insufficient.
What we’re hearing is that people are more concerned with accessing the data than the quality of the data itself. This makes sense! If you can’t use it, who cares how clean it is. We know how you feel. In fact, we built a whole company around it… It also tells us that we should focus on integrating datasets that are particularly difficult to access in their raw published state–like those stuck in PDF format or with major record linking challenges. These datasets present a greater logistical challenge but result in greater positive impact for users.
It also sounds like we need to spend some time helping people navigate different available datasets, starting with those in PUDL, and perhaps extending to the vast array of data available elsewhere. It’s time for us to knuckle down and spiff up our documentation!
What are we going to do about it?
After reading everyone’s responses and processing the information we collected from the 60 informational interviews, we came up with a list of projects that would improve both PUDL and people’s experience working with energy data in general. The core takeaway is a need for more and better documentation. We’re going to make a concerted effort to put ourselves in your shoes and answer some of the longstanding questions about what’s in PUDL and how to navigate it.
In a similar vein, we’re going to try and improve the process of contributing to PUDL, whether through code or useful information about the data. Perhaps an energy data wiki?
Lastly, for those of you that offered, we might reach out for support along the way! We want PUDL to be useful for you, and the best way to ensure that is to involve you in the process.
Stay tuned on our progress by following along on GitHub, and, as always, reach out if there is something you’d like to see us do.
A free training series for energy graduate students
In the course of our work at Catalyst, we’ve been lucky enough to work with energy researchers at many institutions. So often, we see people run into the same set of problems – handling data that’s too big for Excel, reproducibly connecting datasets without shared IDs, and writing code that can be easily re-run and updated when a paper is reviewed or when a new year of data comes in.
Now, thanks to generous funding from the Alfred P. Sloan Foundation Energy & Environment Program, we’re pleased to announce “Open Energy Data for All,” an initiative to support energy graduate students. We’ll offer training in foundational data and software skills that enable faster, more open, and more reproducible energy data analysis.
Here’s what we have planned:
We’re hosting a monthly online seminar series addressing key challenges in energy data analysis
We’re working to develop a hands-on energy data curriculum with support from The Carpentries
We’ll give open energy data tutorials at several conferences around the country
Finally, we’ll host a two-day, in-person data lab, bringing together graduate students from across the U.S. to collectively tackle real-world energy data problems.
Kicking off our monthly seminar series
Whether wrestling with APIs or just trying to find the right dataset for your research, it can be hard to know where to start. That’s why, for our first monthly skill-building webinar, we’re starting with an introduction to the US open energy data landscape. Join us!
Intro to the US Open Energy Data Landscape Oct. 30th, 4:30 – 5:30 PM Eastern (20:30 – 21:30 UTC)
What free and public energy data exists for the U.S., and how can I access it?
How have people used that open data in the energy transition?
What common challenges are there with using this data?
How can I evaluate open datasets I find online?
How may data availability affect my research topics?
We’ll be running more webinars monthly – they’re designed to be drop-in, and will be recorded, so don’t worry too much about missing one or another.
Want to learn more?
If you’re interested in hearing more about these projects, sign up for our workshop newsletter and subscribe to our calendar of events! If you’re a faculty member interested in learning more, or in hosting us for a talk or workshop, we’d love to chat – drop us a line at [email protected].
To kick off our NSF POSE grant work, over 4 weeks in July and August we interviewed more than 60 energy data users as part of NSF’s Innovation Corps program (I-Corps). I-Corps helps POSE awardees better understand their users and contributors, and the potential for fostering a sustainable open source ecosystem.
Some of our interviewees were already PUDL users, and many of them weren’t. A fair number of the PUDL users were at organizations we’d never encountered before! We talked to academic researchers and advocates working at non-profits, but also people at for-profit companies, and folks working in the public sector. We even had the chance to talk to some utilities. Interviewee technical and energy domain backgrounds were diverse: from spreadsheet-only NGOs to startups working with cloud-based data pipelines and orchestration frameworks, and everything in between. There were software engineers and lawyers that argue at FERC, grass roots advocates and regional electricity planning organizations too.
It was an intense month for our sometimes introverted team, but overall it was a good experience and we learned a lot. So we thought we’d share some of our high-level takeaways, and see if they resonate the broader energy data community.
Catalyst is a fully-remote organization with members living all over North America. Our floating cyborg heads are besties, but we’re privy to the power of an analog hang. As such, we host an annual member retreat. This year we chose to meet in Mexico City because it seemed like fun and because it overlapped well with this year’s CSV conf (see Zane’s talk here!)
We booked an Airbnb with a few buffer days so folks could explore the city before getting down to business hashing out Catalyst’s future. We perspired, ate popsicles, and pinched ourselves a few times to make sure we were actually there. Even though we had a lot of work planned for the next few days, we agreed that the retreat would be a success even if all we did was get together.
This year at csv,conf,v8 in Puebla, Mexico I gave a talk on our experience as a democratic worker cooperative creating digital public goods, and why we think co-ops are potentially a good fit for creating public-interest technology. You can watch the recorded talk on YouTube, or read on for a bloggified version of the talk below.
We recently found out that Kamran Tehranchi, one of two primary maintainers of the PyPSA-USA open source power system model, was working on adapting it to use open data that we publish through our Public Utility Data Liberation Project (PUDL), so we interviewed him over email to find out more about his experience making the switch.
Can you tell us a little bit about yourself? What problems are you working on? Where are you at?
Sure! I’m currently a PhD Student at Stanford University working in the Interdisciplinary Energy Systems (INES) Lab. By way of my research, I am also an energy system modeler and open-source software developer. My work focuses on electricity system planning, specifically on the impact of electricity transmission resolution within planning models. I primarily work with engineering-economic simulation and optimization models, mainly production cost simulations and capacity expansion models. I use these models to design and simulate future energy systems to understand the impacts of emerging technologies, policies, and climate-energy system interactions. One of the main projects I’ve been working on this past year is the PyPSA-USA planning model which in-part leverages PUDL to develop the electricity system data model.
We are excited to share that the Public Utility Data Liberation Project (PUDL) and Catalyst Cooperative have been awarded a Pathways to Open Source Ecosystems (POSE) Phase I grant by the National Science Foundation (NSF)! This grant will fund a slate of community building and infrastructure projects to expand the PUDL community and facilitate contributions.
We’ve spent time on community-building activities like developing relationships with open energy modelers, presenting at conferences, hosting office hours, and responding to questions on Github Discussions. We applied for the NSF POSE grant so that we can spend more time fostering the PUDL community and improving people’s experience working with public energy data.
Getting to know our community
Are you a researcher or analyst working with energy data or models? An environmental non-profit, clean energy advocate or data journalist working on the U.S. energy transition? A data engineer or open-source expert interested in contributing to the energy transition?
If so, we would love to talk to you! For the first step of our POSE grant, we’re conducting a series of half-hour interviews over the next month to better understand how people find, prepare, and work with energy data, the different contexts they’re working in, and what their biggest data pain points and challenges are. You can sign up using this link. Please spread the word and forward this link to anyone you think might be interested!
Our Focus Areas
With POSE funding, we’ll be working to get PUDL data into more hands and creating new opportunities to contribute back to the PUDL ecosystem. Here’s a glimpse into what’s in the works:
Exploring new front-end tools to make PUDL data easier to access: We’re busy prototyping an alternative to our existing UI tool. Stay tuned, we’ll be looking for users to give us feedback on our beta tool!
Creating new resources for PUDL users: We’ll be hosting a webinar aimed at nonprofits and developing new data access tutorials to make accessing our data easier than ever before.
Supporting PUDL’s contributors: We’ll be developing new resources and coordination practices for external contributors, and creating a contributor onboarding workshop.
Addressing technical barriers to contribution: Whether refactoring memory-intensive tests, or improving our data validation framework using Pandera, Pydantic, and Dagster asset checks, we’re excited to implement some long-awaited improvements to support more distributed development.
Coming to a town near you!: We’ll be traveling to academic conferences, university brown-bags, FOSS meetups and more in order to present on the PUDL project and connect with other clean energy advocates.
Developing organizational models and governance practices to sustain our growing ecosystem: In conversation with our downstream users, we’ll be developing strategies to keep PUDL free, accessible and maintained in the long-term.
We’ll be sharing updates on POSE-funded projects on our socials, blog and newsletter over the coming months. If you want to learn more about any of these projects, get in touch via [email protected] or drop by our office hours.
Catalyst is very excited to announce that we have hired Nancy Amandi as a technical writer for PUDL’s Google Season of Docs project (full proposal here). The project will run from June through October, during which time Nancy will work on improving our documentation to make it easier for PUDL users to navigate and find the data they need.
Currently, it’s difficult for new (and long-time) PUDL users and contributors to quickly jump in and start using PUDL because our documentation is extensive and spread out between multiple repositories and websites. We have a data dictionary page in our docs, a Datasette deployment for exploring the data, and a set of example notebooks hosted on Kaggle, but none do a particularly good job of shepherding users to the data they want. The goal of this project is to create a better, more nested, system of table/column documentation so users aren’t overwhelmed by PUDL and know where to find the latest versions of the tables that are most relevant to them!
If you’ve ever struggled to navigate the PUDL docs and have feedback, please send an email to [email protected], and we will incorporate suggestions into our plan for the project.
About Nancy
Nancy is a data engineer and technical writer living in Nigeria. She’s passionate about helping data-driven businesses write clear, concise documentation to convey complex technical concepts to a diverse range of audiences. In addition to her writing, Nancy has extensive experience in creating scalable data pipelines, exhaustive data mining, explanatory datasets, analytical models, and business reporting solutions with structured, semi-structured, and unstructured data. In 2023, Nancy and her team members won the Nigeria Energy Forum Tertiary Institutions Energy Pitch Challenge for their work on OneGrid Energies, a clean tech startup working towards closing the energy affordability gap in Nigeria.