Today’s column also features a very depressing chart. It comes from a report published last year by the Congressional Budget Office and it shows that poor people now get about three-fourths of their “income” from handouts.
That’s far different from the data in 1979, when poor people actually earned about two-thirds of their income.
Here are some excerpts from the CBO report, documenting the shift from private income to government dependency.
For people in households with money income below the poverty threshold, the composition of that income has changed over time… In particular, the percentage of total income that is accounted for by money income decreased from 1979 to 2021… In 1979, money income accounted for nearly two-thirds of total income, and in-kind transfers (both health-related transfers and those unrelated to health) accounted for about one-third. In 2021, money income accounted for about one-quarter of total income, and in-kind transfers accounted for more than half.
The shift from private income to government handouts is distressing because the goal should be self-sufficiency.
Some of our friends on the left, however, think the goal should simply be to make sure the poor have money.
I wrote a two-part series (here and here) about this divergence.
There’s one other visual from the CBO report that I want to share, mostly because it underscores the wisdom of the late Walter Williams.
Walter pointed out that there is a very simple recipe for minimizing the odds of being poor.
As shown by Figure 14, he was right. The big difference between the charts is that the lowest quintile has a disproportionately large number of households that are “unmarried with children.”
For what it’s worth, I don’t know if there are easy ways to solve this problem.
But that’s one of the reason that I favor federalism. Get Washington out of the business of income redistribution and allow state and local governments to experiment with the best way of helping poor people without creating permanent dependency.
P.S. If you’re wondering about the orange part of Figure 15 (federal taxes), it’s showing that poor people actually paid some tax until the mid-1990s. Starting about 2000, however, the tax code became a vehicle for additional redistribution thanks to the “refundability” of the earned income credit.
P.P.S. If you’re wondering about the part of Figure 15 for “health-related in-kind transfers,” that’s Medicaid and Obamacare. Those programs don’t produce better health outcomes, but they are definitely huge burdens of taxpayers.
There were seven contestants for the 2025 Counter-Tweet of the Year (here, here, here, here, here, here, and here).
Today, let’s look at our first entry for 2026.
It involves Peter Navarro, who was an “environmental activist” Democrat who ran for office several times in the 1990s on a “no-growth platform” in California.
He’s still against growth today, but he now works for Donald Trump and is a big supporter of the President’s protectionism.
Navarro tweeted triumphantly on January 29 that American steel production in 2025 exceeded Japanese steel production for the first time since 1999.
This sounds like a potentially significant development. I’m sure many people wondered if this meant Trump’s steel tariffs were having a big effect (other than all the lost jobs in the steel-using sector).
Lo and behold, it turns out that America overtook Japan in steel production in large part because Japanese output dropped.
Which motivated Eric Boehm to send out a counter-tweet using the inquisitive-swan meme.
I’ll close by addressing the only persuasive part of Narvarro’s argument. In the video he tweeted, he asserted that other nations subsidized steel exports.
This kind of distortion is contrary to free trade and is precisely why the World Trade Organization should have been strengthened rather than emasculated.
Sadly, that no longer seems to be an option, so the next-best choice should be anti-subsidy/free-trade pacts, especially among western nations.
P.S. If you like the inquisitive-swan meme, here’s another example.
The big problem with foreign aid is that it is based on the wrong-headed notion that you can get more growth by giving money to politicians in poor nations.
There’s only one recipe that has ever turned poor nations into rich nations, but aid bureaucracies have little interest in promoting economic liberty.
But there is a silver lining to this dark cloud.
We periodically get example of aid giveaways that are so silly and foolish that they provide entertainment value.
Consider, for instance, these excerpts from a report in the U.K.-based Telegraph by Hayley Dixon.
A “pleasure-oriented” sex chatbot for Kenyan teenagers was developed using aid money from British taxpayers… The app was built as part of a £41m UK aid program… The Nena chatbot was described as “a pleasure-oriented digital companion for young people exploring sexual health” and aimed at those between the ages of 18 and 24. …It is the latest in a series of disclosures by The Telegraph about aid spending including a £52m “road to nowhere” through the Amazon rainforest and a push to stop ocean plastic pollution in landlocked African countries. …The sex chatbot was funded in 2019 as part of the Foreign, Commonwealth and Development Office (FCDO) Ideas to Impact aid programme which it says is aimed at “testing new technologies and innovative approaches to address development challenges”. The chatbot was designed to encourage safe sex in Kenya, which has the third-largest HIV epidemic in the world and where more than half of new infections are among the young. …of the 1,119 referrals sent to a local sexual health clinic through the app, not a single one led to further action.
From a big-picture perspective, at least the collateral economic damage from a sex chatbot presumably is limited.
So this example of foreign aid isn’t as bad as a handout that expands the size and scope of government (such as IMF transfers that are conditional on tax increases).
I’ll close with a couple of observations, both of which presumably are foreign concepts to the U.K. aid bureaucracy.
Of course, the same could be said for the United States. But at least foreign governments aren’t giving Washington politicians more money to make a bad situation worse.
I have a selfish perspective on this issue. As I wrote last September (consider this column to be Part B), I’ve been in the same house for more than 30 years. It’s a big house, but all my kids are now on their own. Logically, I should sell.
But if I sell, the government will grab a big chunk of my gain (even though a big part of the gain simply represents inflation over the past three-plus decades).
If I stay in my house until I die, by contrast, the kids won’t get hit with the capital gains tax.
As such, since I love my kids more than I love government, I’m not selling.
This problem can and should be fixed.
Ryan Ellis summarized the issue in an article for National Review.
…87 percent of Americans worry about housing costs, and 69 percent fear that their children or grandchildren will never be able to afford a home. These concerns reflect real pressures: Home prices remain high, mortgage rates have increased, and the supply of affordable homes is historically tight. Federal tax policy is making the problem worse. Under current law, homeowners may exclude only $250,000 in capital gains if single, or $500,000 if married, when selling a primary residence. These limits were set during the Clinton administration in 1997 and have never been adjusted for inflation or for rising home values. After nearly three decades of appreciation, many ordinary homeowners already exceed these thresholds, and millions more are on the horizon. A tax rule that once protected most sellers now exposes millions of them to a substantial bill, all from gains derived by inflation (itself caused by the Federal Reserve). …homeowners whose houses no longer fit their needs choose not to sell because the tax consequences are too large. This reduces turnover and limits the number of homes available to younger families seeking entry into the market.
Ryan then explains that there is legislation that would mitigate the problem.
H.R. 1340, the More Homes on the Market Act, addresses this problem directly. The bill would double the capital gains exclusion to $500,000 for single filers and $1 million for married couples and would index those amounts to inflation. Modernizing the exclusion would allow homeowners to sell or change their housing without being penalized for decades of normal appreciation. …H.R. 1340 avoids the pitfalls of heavy-handed interventions. It does not subsidize demand, impose new regulations, or require new spending. It simply removes a federal barrier that prevents homeowners from responding to normal life changes. Families will still sell only when it makes fiscal sense. This reform would merely eliminate an outdated and unintended income tax penalty that blocks ordinary residential mobility. Both YIMBYs and NIMBYs can support this tax cut.
Since it’s no my role to analyze rather than advocate, I mention the legislation mostly because it’s bipartisan.
So this proposed tax change might actually happen even with all the divisions in Washington.
Now let’s get back to policy analysis. Here are some excerpts from a Wall Street Journal column by Jeff Yass and Steve Moore.
Americans are sitting on roughly $55 trillion in nominal unrealized gains in the value of homes and other real estate. That’s one reason why, as home values rose during the recent inflationary period, sales declined from more than six million homes in 2021 to a little over four million in 2025. Millions of empty-nest baby boomers want to downsize and retire but are discouraged from doing so by the prospect of a huge tax bill. That’s called the lock-in effect of the capital-gains tax. It…creates a perverse incentive to store wealth away untouched for decades. A 2020 Brookings Institution analysis put it this way: “Lock-in encourages investors to retain their assets when the economy would benefit from a redeployment of investment capital to higher return ventures or properties.” …One reason aging homeowners don’t sell is because there’s one way of avoiding the capital-gains tax: by dying. When your house passes to your estate, a tax-code provision called the step up in basis at death kicks in, and your gain forever goes untaxed. When your heirs sell the house, they pay tax only on the difference between the value at your death and the sale price.
And Adam Michel of the Cato Institute also wrote recently on the topic.
The capital gains tax encourages holding on to appreciated homes, discourages relocating or downsizing, and raises the after-tax cost of investing in the housing stock. However, these effects are not limited to housing. The economic distortions of the capital gains tax appear whenever an asset is expected to appreciate over time. Homes, businesses, land, stocks, precious metals, artwork, and cryptocurrencies all face the same basic penalty for being sold or exchanged after appreciation. …The lock-in effect also becomes stronger over time. Long-held assets tend to accumulate large nominal gains, and delaying realization can reduce effective tax rates. This is especially true for older owners whose assets will benefit from step-up in basis at death, which allows property to be inherited at its current market value, wiping away the capital gain, and allowing it to be sold with little or no tax. The result is that owners of assets with large potential gains delay sales and avoid reallocating capital to more productive uses to avoid the tax. For example, a homeowner may stay in a house that no longer fits their family or job because selling would trigger a large tax bill.
Here’s the sentence from his article that is most important.
Congress should lower the rate for all investments or, better yet, simply repeal the tax altogether.
Unless you’re a policy wonk, I realize “exciting” may not be the right word to describe new developments in public-finance economics. For nerds, however, three economists at the Joint Committee on Taxation have some important new research on the Laffer Curve.
The study, authored by Rachel Moore, Brandon Pecoraro, and David Splinter, concludes that the United States already is very close to the revenue-maximizing tax rate (which is not the ideal rate, incidentally).
Perhaps even more important, their research finds that the Laffer Curve is relatively flat at the top. This means that raising the top tax rate would do a lot of damage per dollar collected.
Here’s their estimate (solid red line) of the actual Laffer Curve.
For readers who want the main takeaways, here’s study’s abstract.
The Laffer curve peaks at the revenue-maximizing top tax rate, where revenue losses from behavioral responses offset revenue gains from a higher tax rate. Prior studies, however, largely overlook the Laffer curve’s shape, rely on simplified tax functions, and often omit shifting across business types and tax interactions. We show that modeling distinct tax bases more accurately and incorporating these interactions lowers the revenue-maximizing top tax rate and the associated revenue gains, yielding “flat” Laffer curves. Over this flat region, increasing the top tax rate raises relatively little revenue. Instead, raising top rates primarily trades off between progressivity and growth.
For wonkier readers, here are some excerpts that caught my attention.
Using a detailed representation of U.S. federal taxes, we find that long-run Laffer curves are relatively “flat.” This has significant policy implications—large changes in top tax rates around the revenue-maximizing rate yield small changes to revenue. Over the flat part of the Laffer curve, the relevant policy choice is between tax progressivity and growth: the equity-efficiency tradeoff. …Under our true base, three behavioral responses offset mechanical tax-rate increases: reduced labor and capital income in the ordinary base, reduced capital income in the preferential base, and shifts in activity across corporate and noncorporate sectors. …The true tax base yields a flatter Laffer curve and decreases potential revenues by over one percentage point. Allowing for full sectoral shifting responses further flattens the Laffer curve, reducing potential revenues by nearly another percentage point. …These results imply less emphasis should be placed on the precise revenue-maximizing rate, as only modest long-run revenue gains result from increasing the top rate along a flat Laffer curve.
A “flat” Laffer Curve has major implications, some of which I discussed when analyzing other academic research back in 2012.
Here’s what the JCT authors concluded.
Laffer curves are relatively flat—meaning that even substantial changes in the top tax rate around the revenue-maximizing rate have only modest effects on total tax revenues. Rather than raising more tax revenue, the central policy tradeoff concerns the balance between tax progressivity and growth: the equity-efficiency tradeoff. …The true tax base lies between the narrow and the broad base. The Laffer curve estimated using the tax calculator and true base reaches a more modest peak (only 1.3% more tax revenue) at a top tax rate of 47%. Notably, this additional federal income tax revenue is only about 0.1% of GDP. Relative to both the narrow and broad bases, the true base implies smaller potential revenue gains and a lower revenue-maximizing top tax rate.
Notice an important implication.
Regardless of the revenue-maximizing tax rate, a Laffer Curve that is flat at the top implies a lot of foregone economic output per dollar raised for politicians.
In other words, as noted in my two-part series (here and here), there is a meaningful tradeoff between tax rates and growth.
Indeed, Figure 2 from the study (especially Panel B) presents the Arthur Okun tradeoff and informs us that ever-higher tax rates generate no revenue because of foregone growth.
Indeed, revenues actually fall as tax rates get too high.
Here are some concluding thoughts from the authors.
…the tax calculator with a true base shows a relatively flat Laffer curve. …For flat Laffer curves, deviations of the top tax rate around the revenue-maximizing rate have minor effects on federal individual income tax revenue. …Under the tax calculator with a true tax base, increasing the top tax rate two percentage points to 39% raises total taxes by only about 0.2%. Thus, when considering all levels of government, increasing the top rate to the revenue-maximizing level results in total revenue gains of less than 0.1% of GDP. … in the neighborhood of the revenue-maximizing tax rate, further raising top tax rates presents a tradeoff between tax progressivity and growth, rather than an opportunity to raise substantially more revenue.
For my concluding thoughts, it is noteworthy that the authors are from the Joint Committee on Taxation because that is the body on Capitol Hill that does the official revenue estimates for congressional legislation.
In the past, I was critical of the JCT for not properly assessing the negative effects of higher tax rates when estimating proposed policy changes. Hopefully, that problem might be a thing of the past.
Every year or so (2025, 2024, 2024, 2021, 2019, 2017, 2017, etc), I share data showing that a European-sized welfare state requires massive tax increases on lower-income and middle-class household.
Let’s add a 2026 column to the list.
Here’s a chart comparing tax burdens on middle-class Americans and middle-class people from France.
As you can see, French households are being pillaged at much higher rates than American households.
interestingly, the chart comes from an editorial in the Washington Post. Here are some excerpts.
Like other European countries, France doesn’t tax only the rich at higher rates than the U.S. It also taxes ordinary workers more too, OECD data show. A lot more. The average single French worker gets to keep only 53 percent of his or her pay after taxes, compared with 70 percent for the average single American worker. For average one-earner families with two children, the tax burden is almost twice as high in France as in America. And those figures are only for taxes on labor. They don’t include the burden of France’s national value-added tax, with a standard rate of 20 percent on consumer purchases of goods and services. (Compare that with the average U.S. sales tax rate of 7.53 percent.) France’s massive welfare state was not built by taxing the rich. It was built by taxing the rich and everyone else at far higher rates than Americans would ever tolerate.
It’s not just that the French pay higher taxes.
They also have lower levels of income, which is another point I’ve repeatedly made (2023, 2021, 2021, 2020, 2019, etc).
France also has lower average gross wages (adjusted for purchasing power), a much higher unemployment rate and much slower economic growth than the U.S. These stats of shame are all related.
Just in case you don’t believe that French living standards are lower, here’s a chart showing per-capita GDP (featuring data from the IMF, World Bank, United Nations, and Maddison).
In other words, ordinary people in France are victimized two ways. They get less income and they have to pay more tax.
I’ll close by noting that France also tries to squeeze the rich (in some cases with tax rates above 100 percent!). But those tax rates generally don’t generate much revenue because of the Laffer Curve, as I noted just five days ago.
The bottom line is that nations with big welfare states have to target middle-class and lower-income taxpayers. Simply stated, there are not enough rich people to finance big government. Not in France, not in America, not anywhere.
Local politicians also believe that bums in the city should get high at taxpayer expense.
I’m not joking. Here are some excerpts from a 2024 report in the New York Post.
A program that offers free booze to the homeless alcoholics that roam San Francisco caught flak this week when a tech CEO questioned the logic of feeding the addictions of the city’s street dwellers. Adam Nathan, founder and CEO of the small business AI marketing tool Blaze and the chair of the Salvation Army San Francisco Metro Advisory Board, posted a thread on X slamming the program after watching a string of unhoused drunks line up for their shots, stating it “just doesn’t feel right.” …the four-year-old “managed alcohol program” actually costs the city $5 million a year, the San Francisco Chronicle reported. The program as described by the Chronicle sees nurses dispense “controlled doses” of vodka and beer to street people at specific times of the day.
From a big-picture perspective, $5 million is chump change, particularly when compared to billions and billions of dollars of fraud in redistribution programs such as food stamps, welfare, and Medicaid.
But it is nonetheless baffling that politicians in San Francisco at some point made a conscious decision to give away free booze.
I’ll close with two observations.
First, San Francisco actually elected a semi-rational mayor who took office in early 2025, so I wonder whether he has continued this specific boondoggle. Hopefully he will watch what Mamdani does and then do the opposite.
Two, local governments should have leeway to squander money in strange ways, so long as they are using their own money and not mooching from state and/or federal taxpayers. Three cheers for real federalism.
As a citizen, I dislike protectionism because it enriches D.C. insiders such as lobbyists.
But Trump’s trade taxes are just part of the problem.
Washington is basically a racket for the benefit of the political class. And the bigger government gets, the greater the opportunities for sleaze.
And since government is getting bigger under Trump, nobody should be surprised that lobbyists are making out like bandits.
Let’s start with some excerpts from a Politico report by Caitlin Oprysko.
President Donald Trump’s second term is already delivering a massive payday for Washington’s top lobbying shops… Thirteen of the largest 20 firms by revenue reported growth of 10 percent or more compared to 2024. In total, they brought in nearly $824 million, up from $595 million during the final year of the Biden administration. …While federal lobbying spending has been climbing steadily for the past decade…Trump’s aggressive use of executive power and influence is supercharging the trend. …Some of the firms that saw the most dramatic windfalls were those with close ties to Trump and top administration officials. Ballard Partners, which counts Attorney General Pam Bondi and White House chief of staff Susie Wiles among its alumni, signed more than 200 new clients after Trump’s election. …Looking ahead, lobbyists expect trade to continue driving client interest in 2026.
And those clients want lobbyists with connections to the Trump Administration.
Here are some excerpts from an article Tim Carney wrote last year for the Washington Examiner.
How did Amazon executives react when Trump won the White House? They hired Brian Ballard, Trump’s old lawyer, major donor, and Florida finance director, who was presently raising money for the president’s inauguration, to be Amazon’s lobbyist. Amazon contributed more than $50,000 to that inauguration. This is how Washington, D.C., works under Trump. Its mercurial and axe-grinding president threatens a private company, specifically or vaguely, and the company responds by hiring his friends as lobbyists. The racket lacks subtlety under Trump, but it’s not new. Democrats, including former President Barack Obama and Senate Minority Leader Chuck Schumer (D-NY), have long practiced this sort of shakedown politics expertly. In fact, it’s inevitable… The government’s power to regulate and tax, that is, its power to destroy, gives Trump leverage, and he is not a man to let leverage go unused. …Trump…is just functioning as those who wield federal power always function: using government power to extract value from private companies. Sometimes, this means hiring friends and family. Sometimes, it means cutting campaign checks. Sometimes, it means helping the incumbents politically.
The bottom line is that I was unhappy when Democratic insiders were benefiting from big government and I’m unhappy once again now that Republican insiders are benefiting from big government.
P.S. I fully endorse and embrace the right to lobby. It’s part of the 1st Amendment. And I also acknowledge that lobbying is good when people or businesses come together to protect themselves from predatory behavior by politicians and bureaucrats. But even ethical lobbying is economically inefficient. Which is why good policy is small government and small government is also good government.
Lobbyists would have far fewer clients if we had a simple and fair flat tax instead of the current, convoluted internal revenue code.
Lobbyists would have far fewer clients if we had genuine free trade instead of Trump’s chaotic and ever-changing protectionism.
Lobbyists would have far fewer clients if there was less red tape, meaning businesses could concentrate on satisfying consumers.
Lobbyists would have far fewer clients if the health care sector wasn’t so dominated and driven by government programs and policies.
Lobbyists would have far fewer clients if we had small government so that the corrupt process of earmarks dried up and evaporated.
About five years ago, I fretted about the gradual erosion of economic liberty in Western Europe.
And I followed up two years ago with similar analysis, grousing that the entire western world was joining Western Europe in the drift toward more statism.
When you combine this grim trend with data about demographic decline, which is even more discouraging, it is very difficult to feel optimism about Europe’s future.
Given my concerns, I was very intrigued by a column in the Washington Post by David Ignatius. He writes that conflicts and disagreements with Trump will lead Europeans to focus more on growth.
Here are some excerpts.
Europe’s stagnation has been a background theme of nearly every Davos conference I’ve attended for 25 years. Changing that status quo was hard, while following America’s lead was easy. But Trump has shifted that balance in his second term. He has transformed the transatlantic alliance into a humiliating exercise in tariffs, White House demands and insults. …Canadian Prime Minister Mark Carney, whom I’ll count here as an honorary European, …listed a string of independence measures his country is taking, including a new “strategic partnership” with China. …Europe needs to fix an economy that “still lags behind that of the U.S.,” said French President Emmanuel Macron. …European leaders know they are being left behind…and they finally seem to recognize that the European Union’s rules and regulations, and its heavy tax burden, are stifling the growth they need. European leaders want their own version of “Liberation Day.” …it means creating innovation-friendly economies at home — with fewer rules, lower taxes and a less rigid welfare system. …But in Britain and Europe, weak leaders haven’t been able to implement reforms — and Euro-sclerosis seems worse than ever. …The Greenland putsch might finally have shocked Europeans into taking control of their destiny — and beginning the economic reforms they need to survive as prosperous countries.
I like this hypothesis. I want it to be true.
Europe needs more economic freedom, and I don’t care if they adopt good policy because they are copying Javier Milei or because they don’t like Trump.
That being said, I don’t think the hypothesis is correct. Let’s look at recent policy developments in the five major European countries.
Spain is in the midst of a spending spree that has increased the burden of government and dramatically boosted government debt levels.
Italy may not be going in the wrong direction as fast as some other European countries, but fiscal policy is gradually worsening and there are no plans to halt this decline.
By the way, it’s not just the five big nations of Western Europe. If you look at the 15 nations that were part of the European Union before it expanded to Eastern Europe, every single one of them has less economic liberty today than in 2000.
The average decline is .29 on a 0-10 scale according to the Fraser Institute.
The bottom line is that I want this downward slide to change. Unfortunately, I don’t see that happening.
P.S. The column mentioned the Draghi Report, but I was not impressed by that document’s milquetoast recommendations.
P.P.P.S. If it makes Europeans feel better, economic liberty also has been declining in the United States this century (those who cherish bipartisanship will be happy to know that Bush, Obama, Biden, and Trump all deserve part of the blame).
One piece of evidence is that has happened to Argentina’s country risk he was elected.
The above chart comes from a Bloomberg report authored by David Feliba. Here are some excerpts.
A key measure of Argentina’s sovereign risk fell to its lowest level in seven years as policy changes by President Javier Milei’s administration left the nation closer to a return to international debt markets. The extra yield investors demand to hold Argentina’s sovereign debt over US Treasuries with similar maturity fell below 559 basis points on Friday, according to a JPMorgan index. The spread, which is now at the lowest since July 2018, has almost halved since Argentina’s midterm elections in late October when Milei’s party won by more than expected and more than doubled its seats in Congress.
I also think a recent editorial from the Washington Post makes a key point about Milei delivering results rather than mere rhetoric.
Since his surprise win in December 2023, the economist-turned-president has made it his mission at Davos to make an unabashed and optimistic case for capitalism. This year was no exception. …He speaks from experience. When he entered the Casa Rosada, inflation was running at 25 percent month-on-month. The resource-rich country had fallen into abject poverty. Milei’s relentless pursuit of free market reforms is working. He turned a fiscal deficit of 15 percent of his gross domestic product into a small fiscal surplus, slowing the inflation rate to 2.8 percent, and reducing poverty levels from nearly 60 percent to around 30 percent. …he’s made 13,500 reforms since taking office to make the economy more dynamic. …Trump is often credited with delivering hard truths to Davos attendees, but it’s Milei’s policies that are actually upending the status quo. Unlike Trump, the self-proclaimed anarcho-capitalist has been working to eradicate trade barriers… But what truly sets the Argentine president apart from other leaders is his desire to reduce his own power and control.
Authored by Jeremy Mckeown, it highlights some of Milei’s achievements.
Argentinians have lived through a high-stakes experiment in fiscal discipline and deregulation. For investors looking on, there has been a remarkable macroeconomic stabilisation with plummeting inflation amid early signs of robust economic growth. …Milei has added valuable extra time. His success matters beyond Argentina. Milei’s overarching achievement so far has been to strangle the hyperinflation that threatened to consume the nation in 2023. He inherited an economy on the brink of collapse, with an annualised inflation rate of 15,000%, a fiscal deficit equivalent to 15% of GDP, and no borrowing capacity. His response was immediate and uncompromising. In the words of his British political hero, there was no alternative. Milei slashed public spending, cutting the number of government ministries by more than half and laying off tens of thousands of public workers. By March 2024, Argentina recorded its first fiscal surplus in a generation. The effect on prices was dramatic. …for Argentinians, …with Milei, they have a man honest enough to tell them the truth and survive.
Some of the numbers are repetitive, though I can never get enough of good news.
But I mostly wanted to share his final story because of the observation that Milei is unique, not just because of his support for good policy, but also because he tells the truth (and wins elections).
Given my libertarian sensibilities, I think people who earn money deserve to keep as much of their income as possible. At least 90 percent.
Given my economic training, I think people who earn money should get to keep as much of their income as possible because I want them to have incentives to generate more prosperity.
In other words, class-warfare taxes can cause a lot of economic damage, but they don’t generate a lot of tax revenue.
Which leads me to share this report from the U.K.-based Financial Times. Written by Leila Abboud, it has what I’m calling the world’s least surprising headline.
Here are some excerpts.
A special income tax on high earners in France last year raised only a fraction of what the government had hoped for…and proceeds this year are again expected to be lower than budgeted. The French finance ministry said that a so-called “differential contribution” applying to those earning more than €250,000 a year raised only €400mn for the 2025 tax year instead of the €1.9bn it initially projected. …For 2026, the tax is expected to raise €650mn, €1bn less than planned, the ministry said, creating a budgetary hole… The shortfall from the extra income tax on high earners…also shows the challenges of crafting taxes on the rich that work. Wealthy people often turn to “optimisation” or avoidance techniques to reduce their exposure, such as moving assets or keeping them in holding companies. In the 1980s, about half of OECD countries had some form of wealth tax, while only a handful now do so, and they raise modest revenue for state coffers.
What’s happening in France could be called “Revenge of the Laffer Curve.” Greedy politicians can target the rich, but such initiatives always backfire.
In this case, the class-warfare tax backfired by collecting only a fraction of the revenue politicians wanted. As the French would say, “Quelle surprise.”
I didn’t do my three annual columns mocking communism until June, October, and November last year.
So let’s get an earlier start this year.
We’ll start with a Venn Diagram. I prefer the one I created, but this one is very good.
Since Brigitte Bardot recently passed away, here’s a joke from the 1970s/1980s to commemorate her life.
Or to commemorate the desire of normal people to escape totalitarian communism.
Brigitte Bardot comes to visit the USSR. Brezhnev falls in love with her and says: “Brigitte, be mine. I’ll fulfill any of your desires.”
She says: “Leonid, open the borders.” Brezhnev: “Aren’t you clever! You want us to be left here alone?
Next, we have the difference between understanding Marx and reading Marx.
Our fourth item is true to some extent, though this Thomas Sowell quote reminds us that brains and common sense are not necessarily the same thing.
Saving the best for last, I might call the left side of this meme “communism in the classroom” instead of “communism in the brochures,” but the message is the same.
The woman on the right, for those who are lucky enough not to recognize her, is a housing appointee for New York City’s socialist mayor. She favors collectivized housing over private housing, yet her family has a $1 million-plus home.
Picking the worst state for tax policy usually means reviewing the foolish policies of states such as California, New York, and New Jersey, while contemplating the relative damage of levies such as personal income taxes, corporate taxes, and sales taxes.
Depending on how the different variables are weighted, there could be different answers.
But what if we want to know the state going in the wrong direction at the fastest rate?
But state lawmakers are not content. They apparently want to make the tax system so bad that Washington becomes the worst of the worst.
Here are some excerpts from a recent Tax Foundation report by Jared Walczak.
In Washington, which had no income taxation until recently, many high earners could face the highest combined state and local top rate in the country—18.037 percent (split across employer and employee)—if lawmakers adopt a new proposed millionaires’ tax. …Governor Bob Ferguson (D) announced his support for percolating legislative proposals to adopt a 9.9 percent income tax on income above $1 million. Such a tax would make the state increasingly undesirable for high earners, particularly in the state’s crucial tech sector. Washington already taxes high earners’ capital gains income with a 9.9 percent rate on capital gains income above $1 million (7 percent between $278,000 and $1 million), and both the state and the city of Seattle have payroll taxes that create significant additional tax burdens on high earners and their employers. …a tax this aggressive would do real damage to Washington’s economy, sending jobs and economic opportunity elsewhere. In particular, for significant swaths of the state’s tech sector, already the target of anomalously high business taxes, a 9.9 percent income tax could prove the last straw, driving any subsequent expansion to other states, and quite possibly taking existing jobs with them.
When you also add in various payroll taxes that apply to income, the Evergreen State would have one of the nation’s worst tax systems.
But some unlucky residents of Seattle would have the dubious honor of enduring the nation’s highest tax burden on income.
Though I suspect Seattle would no longer be home to many rich people and the state of Washington doubtlessly suffer a loss of entrepreneurs, investors, and business owners.
The Wall Street Journal definitely is not impressed. Here are some excerpts from a recent editorial.
Amazon billionaire Jeff Bezos may have seen the tax increases coming in Washington state when he moved to Miami two years ago. And he got out just in time as Democrats who run the Evergreen State—once a low-tax refuge—pursue a new tax-and-spend ratchet. …Revenue hasn’t kept pace with the 60% surge in spending since the start of the pandemic, despite many tax increases. …Mr. Ferguson’s millionaire tax would slam small businesses organized as pass-throughs. Their owners could be forced to pay a 9.9% charge on income that flows through to them, on top of taxes that the businesses pay at the firm level on their gross receipts. Washington has lost 16,000 small businesses in the last five years. Do Democrats want to lose more? …Democrats in Olympia face stiff competition from the likes of New York, New Jersey and California. But at their tax-and-spending pace, they are making a run to the tax bottom.
Please note that the real problem is that the spending burden surged by 60 percent. This is what is driving the greed for new taxes (along with the hate-and-envy ideology).
Mark Harmsworth of the Washington Policy Center is worried that further tax increases will negatively impact the state as successful people emigrate.
Washington state, a beacon for innovators and entrepreneurs, is witnessing a troubling trend: a steady outflow of its wealthiest and most entrepreneurial residents. High taxes, burdensome regulations, and an anti-business climate are pushing the wealthiest and high-earners to sunnier, lower-tax havens such as Nevada, Texas, and Florida. …Washington lost a net 222 high-earning millennial households (incomes over $200,000) between 2021 and 2022, the eighth-highest loss nationwide. By mid-2025, a follow-up report showed wealthy Gen Z-ers fleeing even faster, with Washington second only to Illinois in net outflows of affluent young professionals. These aren’t isolated cases; they’re symptomatic of a broader flight fueled by policies like the 2022 capital gains tax and looming wealth tax and income tax proposals. …anecdotal evidence and migration stats show the biggest fish swimming away. The capital gains tax raised $1.2 billion, but at what cost? For every dollar collected, the state risks losing billions in economic activity from departing innovators.
What’s amazing is that some folks on the left are whistling past the graveyard.
Here’s a tweet from the Seattle Times that wins a prize for self-deception (see here and here).
Adding insult to injury (or, to be more accurate, adding injury to injury), there are other simmering tax increases.
Here are passages from a story by Jerry Cornfield in the Washington State Standard.
Democratic state lawmakers are once again eyeing a statewide version of a Seattle tax on companies with large payrolls and high-paid employees. Proposed legislation crafted by Rep. Shaun Scott, D-Seattle, aims to raise more than $2 billion a year. …It targets private employers whose workers earn more than $125,000 a year. It would impose a 5% tax on payroll expenses above that salary threshold. Companies with more than 50 workers, payroll in excess of $7 million and gross receipts of more than $5 million would pay the tax, he said. Businesses may not deduct from employee wages to pay this tax. …Roughly 4,300 businesses would be covered, he said.
I’ll close with a bit of irony. As rich people and big employers leave the state, one indirect effect will be that Washington will become more equal (that is an automatic consequence of shedding population from the top-1 percent).
This should make folks on the left happy. But only because they are wearing ideological blinders and don’t realize that the net effect is to make everyone else in the state poorer.
I tried to warn them more than 10 years ago, but my words fell on deaf ears.
Monetary policy – Like most populists, Trump has an unfortunate knee-jerk desire for easy money. Such policies are popular in the short run (the “sugar high“) but are also a recipe for higher prices and/or financial bubbles in the medium/long run. He wants to depose the current Chairman of the Federal Reserve (who has a pro-inflation track record) because he wants someone even more willing to turn on the figurative printing press.
Regulatory policy – This is Trump’s best area. He instinctively opposes red tape and he has given a green light for his appointees to (mostly) follow a deregulatory agenda.
Rule of law – It’s hard to grade this area. On the positive side, his judicial appointments have largely issued good rulings. On the negative side, Trump governs like there are no rules and norms.
Trade policy – If it was possible to get a grade lower than zero, Trump would qualify. He has been much worse so far in his second term than in his first term.
Though I’m not sure whether to categorize his socialism as bad fiscal policy or bad regulatory policy, so one of his grades should be lower.
Now let’s augment my grades with some observations from others.
We’ll start with a column in the Washington Post by Matthew Lynn, a right-of-center pundit from the United Kingdom.
Trump I is starting to look a lot better. Compared to Trump II, the administration was pro-market and pro-enterprise, neither of which can be claimed for the president’s second term. The Trump presidency of 2017 to 2021 certainly had plenty of flaws. But it was arguably the most business friendly administration Washington D.C. had seen since President Ronald Reagan’s in the 1980s. It may have been characteristically chaotic at times, but there was a serious drive to liberalize the economy, cut regulations, control spending and encourage investment and entrepreneurship. The corporate tax rate was slashed from 35 percent to 21 percent, taking it from one of the highest in the world to one more in line with the global average. …Trump II has been very different. The signature economic policy has been the steepest tariffs imposed by an American government since the 1930s. …The president needs to recover some of the free market drive of his first term. He needs to remind himself of all the things that frustrated him when he was a business guy and start doing something about them. If he doesn’t, his second term will continue to flounder.
For what it’s worth, I think his assessment of Trump’s first term is far too favorable. He’s completely wrong, for instance, about there being “a serious drive to…control spending” in Trump’s first term.
But I agree that the second term seems to be worse.
Now let’s look at some more observations.
Here’s a horrifying – but accurate – headline from NBC.
By contrast, here’s a tweet that should warn the hearts of taxpayers.
Here’s a tweet confirming that Trump is not overseeing a reduction in the size and scope of government.
And here’s an article in Reason that is very dour.
That column included a lot of attention to areas other than economic policy, as libertarians are wont to do.
But if you are a traditional conservative, this tweet from Ryan Ellis should leave you somewhat nauseous.
I’ll close with the observation that Kamala Harris presumably would be trying for a 0.0 grade-point average (though maybe higher since hopefully she wouldn’t be so insanely wrong on trade), so some people will be comforted by Trump being in the White House.
On the other hand, if you expect that Trump’s chaotic governing style and policy mistakes will lead to Democrats having control of both Congress and the White House after the 2028 elections, than it’s quite possible that his second term will wind up leading to worse long-run policy than if Harris had prevailed (a theory I explained in 2012).
As I wrote nine years ago, Oxfam is a pathetic organization. Originally created to help the poor, it has been captured by activists who peddle class warfare.
But they play that role in an incredibly sloppy fashion. In all the debates I’ve been part of over the years, no left-leaning academic has been willing to defend their numbers. And if you click here or here, you’ll understand why.
Over the years, I’ve also shared critiques of the group’s statist ideology and slipshod methodology from Tim Carney, Marian Tupy, and Tony Travers.
If you don’t want to peruse all those columns, all you need to know is that Oxfam has a zero-sum view of the world.
Though I personally think their real motive (like for many folks on the left) is resentment of successful people.
Whatever the real cause, let’s look at Oxfam’s new report on billionaires to see how the organization peddles shoddy numbers.
Here are some excerpts from the organization’s press release.
Billionaire wealth jumped by over 16 per cent in 2025, three times faster than the past five-year average, to $18.3 trillion – its highest level in history… Billionaire wealth has increased by 81 per cent since 2020. …The collective wealth of billionaires last year surged by $2.5 trillion, almost equivalent to the total wealth held by the bottom half of humanity – 4.1 billion people. …The $2.5 trillion rise in billionaires’ wealth would be enough to eradicate extreme poverty 26 times over.
I don’t want to waste much time on a bunch of cranks, so I’ll simply make two points.
First, Oxfam wants readers to be upset that billionaire wealth increased by $2.5 trillion in 2025. And, given all the rhetoric in the report about inequality, a casual reader might conclude that this increase in wealth meant everyone else in society suffered a decline of $2.5 trillion.
Or perhaps billionaires enjoyed more wealth while the rest of us wallowed in stagnation.
So I want to the UBS global wealth report and did a back-of-the-envelope calculation to find the global wealth increase for 2025.
Lo and behold, billionaires got richer, but everyone else in society got richer as well.
Of course, I’d rather be in the group on the left, because that’s a few thousand people dividing up $2.5 trillion, whereas there’s more than 8 billion people dividing up nearly $80 trillion on the right.
But I don’t get upset about some people getting richer faster than other people getting richer, assuming wealth is earned honestly rather than because of government cronyism.
So I’m content to be with the folks on the right, while appreciating the entrepreneurship and investment acumen of the folks on the left.
Second, the Oxfam report states that extreme poverty could be eliminated if politicians confiscated the $2.5 trillion of additional wealth earned by billionaires.
I have two visuals in response to this claim. Here’s a Thomas Sowell quote about the feasibility of the redistribution approach. Yes, perhaps governments could steal $2.5 trillion in year 1 and then give the money to the poor so they have more income that year. But what happens the following year?
Next, here’s a chart from a report by Rachel Sheffield and Robert Rector, in which they explain that politicians in America have spent $22 trillion since the so-called War on Poverty began about 60 years ago.
Lo and behold, all that’s happened is that there is far more dependency today.
Game, set, match.
P.S. I started this column by observing that honest academics never defend Oxfam’s dodgy analysis, even the ones on the left.
Feel free to click on this headline to read someone else’s analysis of Oxfam’s shoddy work.
For purposes of today’s column, I don’t want to merely assert that the Swiss approach is better (though it is). I want to explain how decentralization will make the United States better.
And not simply because it’s the system America’s founders wanted.
There are two big non-ideological reasons to support federalism.
First, it will ease tensions in America. People on the left and right have big fights in Washington about one-size-fits-all policies about everything from abortion to tax policy. A decentralized system doesn’t eliminate those battles, but shifting those fights to the state level means that people in Texas can choose one approach and people in Massachusetts can go in the other direction.
Second, it will help inform policy makers of the best way of addressing different issues, even with regard to non-ideological issues such as highway construction and the size of school districts. This is because state-based lawmakers will be able to see what works best in other states – something that is not possible when major decisions are made in Washington and local officials are mere administrators.
To show federalism shouldn’t be a right-vs-left issues, let’s look at some excerpts from an article in the Intelligencer by Sasha Issenberg.
The author is envisioning two semi-autonomous blocs of states, but I think these arguments also apply to 50 states making 50 choices.
The breadth and depth of the dysfunction has even Establishmentarian figures ready to concede that our current system of governance is fatally broken. …Policy wonks across the spectrum are starting to rethink the federal compact altogether, allowing local governments to capture previously unforeseen responsibilities. …center-left urbanists Bruce Katz and Jeremy Nowak exalt such local policy innovation specifically as a counterweight to the populism that now dominates national politics across the Americas and Europe. Even if they don’t use the term, states’ rights has become a cause for those on the left hoping to do more than the federal government will. Both Jacobin and The Nation have praised what the latter calls “Progressive Federalism.” …Whether measured by county, state, or region, the partisan divide has grown… Red places have grown redder (at least in their presidential votes), blue places bluer. …If we are already living in two political geographies, why not generate a system of government to match?
To augment, Professor Ilya Somin at George Mason University’s Law School has a couple of columns in the Washington Post (here and here) citing left-leaning academics who now favor more decentralization.
I have no philosophical objections to the left-leaning federalists. If they get their way and some states use decentralization to push for bigger government, I’ll warn them they are making policy mistakes, but that’s their choice.
All that matters is that residents should have the right to move away from states imposing bad policy (which already is happening). And that’s already been a teachable moment for the left is states such as Vermont and California.
The bottom line is that leftist arguments for federalism are fine, but I obviously prefer the libertarian(ish) arguments.
We are really 50 micro-countries that have chosen to coexist as one. …we ought to examine the ways in which this vastly diverse group of people has managed to get along and prosper for almost 250 years. …From the beginning, even before we were this big and diverse, our system was designed to allow for peaceful coexistence among very different people. Each state possesses its own executive, legislative, and judicial branch, along with its own constitution. …The founders’ intention was always localized control. This structure of government is what we call federalism. The founders intended the states to operate as laboratories for new ideas and programs. If a state tried a successful approach to a problem, others would take note and replicate it. If a state did something terrible, the harm was mitigated and would impact fewer people. And the federal government was on hand to step in if a state infringed upon individual rights. …People in California shouldn’t be able to force their way of life on people in South Carolina, or vice versa.
…in America today, for every problem, real or imagined, a national “solution” is proposed, regardless of how individual, local, or varied the issues are. …Americans are overwhelmed with ever more “federal government knows best” policies and programs centralized in Washington. And what it does not mandate, the federal government manipulates… America’s Founders did not envision the federal government as being involved in virtually any decision made by anyone, much less as the domineering senior partner for almost every decision made by everyone. …The current nationalization of every decision is blatantly inconsistent with individual rights and our Founders’ federalism, designed to tightly constrain the national government to few, enumerated powers. …Federalism gives citizens an exit option that sharply limits government’s ability to mistreat them.
Good federalism is competitive federalism. It compels junior governments—states—to, well, compete for the talents, affections, and assets of mobile citizens. Consumers and producers can sort themselves into jurisdictions that provide an attractive mix of amenities and public services at an acceptable tax price. …more people get more of what they like. Successful state experiments may induce others to follow; the dispersion of state school choice policies over the past decade may be an example of such “yardstick competition.” Finally, the fear of losing productive firms and citizens may help to discipline spendthrift, overregulating state governments. …competitive federalism has numerous advantages if you put a premium on living in a reasonably free and prosperous society. …our Constitution facilitates (and, rightly understood, nearly commands) competitive federalism. …federalism’s future may hang on a bunch of lawyers and judges. Then again, America’s federalism, more than any other country’s, has always been a lawyerly province, because we live under a constitution that makes it so.
I like all of these arguments, and all three of these columns are worth reading in their entirety.
But the arguments might only be persuasive to readers who already believe in liberty.
So I’m going to close today’s column by citing some research from (the decidedly non-libertarian) International Monetary Fund.
Here are some excerpts from the study, which was authored by Julio Escolano, Luc Eyraud, Marialuz Moreno Badia, Juliane Sarnes, and Anita Tuladhar.
This paper provides new evidence on the impact of decentralization on fiscal behavior, focusing on the EU. Our paper contributes to the literature in two main respects. First, we look at different dimensions of fiscal decentralization (expenditure and revenue decentralization, as well as transfer dependency) and their interactions. Second, we take into account whether fiscal institutions geared toward maintaining budgetary discipline among subnational entities can offset the potential fiscal risks of decentralization. Our results show that fiscal decentralization may improve fiscal performance. First, we find that spending decentralization improves the fiscal position of the general government. This is consistent with the efficiency arguments in favor of spending autonomy. Nevertheless, high transfer dependency reduces the positive effect of spending decentralization.
Regarding the last sentence, true federalism is having subnational governments raise and spend money. So I’m not surprised that national-to-subnational transfers undermine the benefits of decentralization.
But let’s not digress. Here’s Figure 3 from the IMF study.
As the authors wrote:
We use fiscal data from Eurostat covering the years 1995-2008 and look at different indicators (balance and debt) to assess the performance of the general government. The main findings are…Spending decentralization is associated with better fiscal performance at the general government level (Figure 3).
These findings are very powerful precisely because they come from the IMF. Likewise with some pro-centralization research from the OECD that I wrote about in 2020.
By contrast, it’s not surprising that academic economists acknowledge the benefits of federalism.
P.S. As I recently wrote, federalism is a way of minimizing (or at least constraining) the type of fraud we see in states such as Minnesota.
Two months ago, I shared some data showing that his policies were hurting blue-collar workers.
Today, let’s specifically look at manufacturing employment. We’ll start with this chart showing that jobs in that sector have declined ever since Trump started his trade war on “Liberation Day.”
The charts comes from a column for Bloomberg, authored Scott Lincicome.
Here are some passages.
US manufacturing ended 2025 with a thud, capping a rough year for the sector. To recap, manufacturers shed 63,000 jobs, according to the latest data from the Bureau of Labor Statistics. It wasn’t just labor that was hurting. The Institute for Supply Management’s manufacturing index clocked in at 47.9 for December, marking the 10th consecutive month of contraction as new orders were especially weak and costs at historically elevated levels. …the evidence reveals a sector that’s stagnant at best, and a long way from the manufacturing renaissance President Donald Trump promised when he took office for a second time a year ago. …The most basic problem is that modern American manufacturing depends on international trade. As documented by the National Association of Manufacturers, 91% of manufacturers use imports to make things in America, and these inputs constitute around half of all US goods imported each year. Advanced industries such as semiconductors, aerospace and medical devices are particularly reliant on complex global supply chains and cutting-edge components from around the world. …Trump’s broad and indiscriminate tariffs confound domestic manufacturing operations in myriad ways. Most obviously, they increase production costs – even when firms buy American. Tariffs on steel, aluminum and copper drove prices in the US for these critical materials to significant premiums over global benchmarks. Tariffs on parts and equipment raise the same issues.
That’s a damning indictment.
But there’s more.
The second problem stems not from the level of tariff rates, but how they’ve been implemented. …Last year, the US tariff code was amended 50 times, a non-pandemic record and far above the pre-Trump standard. These changes, along with constant tariff threats, caused an unprecedented increase in trade policy uncertainty, which weighed on manufacturers’ hiring, capital expenditures, supply chain and sales plans… Complexity has imposed additional costs. By the end of last year, 20 different tariff measures applied to significant volumes of US imports, up from just three in 2017. …tariff complexity has pushed US firms to scuttle major operational decisions until they have more clarity.
Regarding his point about tariff complexity, he shared this very depressing flowchart last month.
This is perhaps not as bad as tax code complexity, but it’s a disaster nonetheless.
Needless costs being imposed on American employers, with workers ultimately bearing a big chunk of the burden.
Let’s return to the topic of manufacturing employment. Writing for the Washington Post, David Lynch shares some unfortunate data. Here are some excerpts.
President Donald Trump made a clear promise in the spring: “Jobs and factories will come roaring back into our country.” They haven’t. Manufacturing employment has declined every month since Trump declared “Liberation Day” in April… U.S. factories employ 12.7 million people today, 72,000 fewer than when Trump made his Rose Garden announcement. …That’s because roughly half of U.S. imports are “intermediate” goods that American companies use to make finished products… So while tariffs have protected American manufacturers such as steel mills from foreign competition, they have raised costs for many others. Auto and auto parts employment, for example, has dipped by about 20,000 jobs since April. …Small and midsize businesses have found Trump’s on-again, off-again tariffs especially vexing. …Industries producing more technologically complex goods such as aircraft and semiconductors also are paying an outsize price… Makers of semiconductors, for example, shed more than 13,000 jobs since April.
Lynch’s article included this chart. It’s about manufacturing activity rather than jobs, but the two are correlated.
As you can see, it does not appear that Trump’s protectionism is having a good impact.
An editorial in the Wall Street Journal last month also observes that Trump’s protectionism has backfired for blue-collar workers.
…private employers aren’t laying off workers in large numbers but they also aren’t hiring all that many. The question is why? …Our main suspect is the impact of tariffs and the uncertainty Mr. Trump’s willy-nilly border tax policies have caused. …One big statistical reason to suspect that tariffs are hurting jobs is the trend in manufacturing. Remember when tariffs were supposed to produce a U.S. manufacturing boom? It hasn’t happened. In January BLS reported 12,755,000 workers in all manufacturing industries. The number rose by a few thousand through April, but then began to fall each month and in November hit 12,697,000. That’s a net loss of 58,000 jobs, including 19,000 in the last three months. Further evidence comes from the industries affected most by Mr. Trump’s tariffs of 50% on steel and aluminum and 25% on autos and auto parts. Employment in motor vehicles and parts fell 15,000 since January, while it remained flat in steel-making and aluminum manufacturing. This doesn’t count the job losses in downstream manufacturing firms that use steel and aluminum. Some renaissance.
Last but not least, let’s look at some research published by the American Enterprise Institute.
Gary Clyde Hufbauer and Ye Zhang estimated how much it would cost the economy to artificially boost manufacturing jobs.
…this report…roughly estimates the hypothetical tariff rate needed to eliminate the US trade deficit in manufactured goods, the number of jobs that would thereby shift from other sectors to manufacturing activity, and the economic cost of this endeavor. …Replacement production of $641 billion manufactured imports would entail about $321 billion of new manufacturing value added… In turn, the additional manufacturing value added of $321 billion entails roughly 1.42 million jobs. Each job created entails an annual cost of $225,000 for an indefinite period… The cost is paid through higher prices of manufactures purchased by US households and business firms. …However, this calculation critically depends on the assumed 0.5 pass-through coefficient. If the coefficient is actually close to 1.0, as estimated by independent scholars, the total cost would be $642 billion annually, and the cost per job-year would be $550,000.
For what it’s worth, I think $550,000 per job is more accurate than $225,000.
But set that aside. The key takeaway from this research is protectionism is a net job destroyer. The resources diverted to create manufacturing jobs are no longer available to create jobs elsewhere in the economy.
The bottom line is that there’s a tried-and-truerecipe for job creation. Sadly, Trump seems incapable of following those directions.
P.P.S. Because of productivity increases, manufacturing employment has been on a downward trajectory for decades, so some job losses may have occurred even if Trump had good trade policy.
P.P.P.S. Because of changing market conditions, there will always be some job losses. The goal of policy makers should be to make sure that there are pro-growth policies so that there is net job creation.
While I periodically disagree with some of the magazine’s analysis (see here, here, and here), I enjoy perusing the Economist because it covers issues I care about.
A recent headline in the U.K.-based publication caught my attention. The world’s biggest problem, according to the article, supposedly is that people feel gloomy.
The article correctly explains that there are reasons to feel dour, but that’s not the focus of today’s column. Instead, I started thinking about what I think is the world’s main economic problem.
Governments created tax-and-transfer programs in many nations based on the assumption that there would always be a population pyramid, meaning lots of young taxpayers to finance pensions and health care for old people.
But people are now living longer and having fewer kids. As such, the population pyramid in almost every developed nation is becoming a population cylinder.
Pointing out that there is a problem is easy. Indeed, very few serious people think otherwise.
The hard part is convincing politicians to enact reforms that will avert future crises.
Very few nations are dealing with the problem of health entitlements. Yes, Switzerland seems to be characteristically sensible, but other nations either rely on rationing to control costs (goodbye, grandma) or they allow ever-larger spending burdens.
So it’s very appropriate that we’ll be focusing on Zohran Mamdani, New York City’s new mayor who openly extolled the supposed “warmth of collectivism” in his inaugural address.
This was superior, he claimed, when compared to “the frigidity of rugged individualism.”
Which led one clever person to point out that you can see the difference from outer space.
So I’ll start today’s Mamdani-themed humor with another comparison of rugged individualism and warm collectivism.
Some Mamdani humor focuses on whether residents have voted for economic suicide.
Based on this recent chart from Robin Brooks at the Brookings Institution, something has gone wrong in recent years.
As you can see, Mexican growth was keeping pace with U.S. growth from about 2006-2017. But then Mexican growth ground to a halt, pre-pandemic, during the pandemic, and post-pandemic.
First, U.S. politicians might be doing something smart. But American growth has not been spectacular over the past eight years, so that explanation doesn’t hold water.
Second, Mexican politicians might be doing something dumb. And since economic freedom is lagging in Mexico, this explanation seems very reasonable.
In his column, Brooks mostly focuses on explaining that Mexico has stagnated, so I have no idea whether he would agree or disagree with my hypothesis.
But here’s some evidence for my viewpoint. Here’s a chart, based on IMF data, showing that the fiscal burden in Mexico has increased over time.
Both taxes and spending are now a heavier weight on Mexico’s economy, and note that most of the additional spending burden has been imposed since Mexico opted for populist-left rule in 2018 (AMLO followed by Sheinbaum).
Fiscal policy is just one of many variables that determine economic output.
And the EFW data clearly shows that rule of law and red tape are the biggest problem areas. Nonetheless, it is bad news that those mistakes are now being exacerbated by fiscal mistakes.
Since I was combing through the IMF database, I also created this chart that shows per-capita GDP levels over time.
The overall picture is weak growth over the past 45 years, though there was improved performance after 1985 thanks to some pro-market reforms.
In recent years, however, per-capita GDP has been completely flat.
The bottom line is that Mexico is caught in the “middle-income trap.” A few nations have shown how to break past that barrier, but there’s is almost no hope (at least in the next few years) that Mexican politicians will adopt a Milei-style agenda.
P.S. Trump’s trade taxes are bad news for Mexico, and that’s not the fault of Mexican politicians. So weak Mexican data in 2025 (and future years) is partially the fault of the United States.
As I wrote last month, I sort of hope that California voters approve a referendum approved that would impose a huge wealth tax on California’s most-successful investors, entrepreneurs and business owners.
But I’m not cheering for a bad outcome because I’m a bad person.
Instead, I think the negative impact of such a scheme would be a teachable moment. As I noted in that column:
..part of me would be happy if they voted yes. After all, it helps to have bad examples when teaching economics. Actually, California already is a bad example. Enacting a wealth tax would make it a catastrophic example.
In other words, people could learn from California’s mistakes, thus leading to a net boost for freedom and prosperity.
But it may be that the teachable moment already has occurred. To be more specific, there’s apparently been a significant exodus of successful people from California.
They see the handwriting on the wall.
They are not stupid (and their financial and tax advisors definitely are not stupid).
They understand that the tax would be retroactive to January 1.
So they have already taken steps to make sure they can avoid the tax if it gets enacted.
For those of you who want something more substantive than a clever visual, here are some excerpts from a Bloomberg report by Biz Carson and Dylan Sloan.
At least a half-dozen billionaires left California before the new year, and their exodus could soon be followed by more than a dozen others in the face of a proposed 5% tax on their wealth, according to financial advisers to the rich. David Lesperance, who specializes in relocation and expatriation, said he personally helped four billionaires leave the state ahead of the bill’s Jan. 1 residency cut-off date. Two other billionaires — Peter Thiel and David Sacks — both publicly announced new office locations on New Year’s Eve as they departed for Florida and Texas, respectively. Iconiq Capital founder Divesh Makan knows four or five families that have left already, and he expects another 15 to 20 will leave if the tax is approved, he said in an email. Alphabet Inc. co-founder Larry Page has also moved out of the state, according to a report in Business Insider. …A state analysis calculated that while a wealth tax could generate “tens of billions of dollars” in one-time revenue, it could end up costing California hundreds of millions per year in long-term revenue if billionaires choose to leave.
A story in the New York Post by Nina Joudeh is even blunter.
California lost a mind-boggling nearly $1 trillion in wealth in the past month alone thanks to fears over its proposed “Billionaire Tax,’’ according to one of the state’s wealthiest residents. …“Collectively, the amount of Billionaire wealth that has left California in the last month (!) is now in excess of $700B,” fumed venture capitalist and former Facebook exec Chamath Palihapitiya on X on Friday. …“I would not be surprised if 2026 ended with less than $1T of billionaire wealth in California and decades and hundreds of lawsuits,’’ Palihapitiya said… The mere fear of the possibility of the measure — which could go to the polls in November 2026, making its potential start date retroactive — has reportedly left a slew of California’s roughly 215 billionaires to scoop up homes in states such as Florida and Tennessee and relocate at least some of their company offices out of state, too.
Let’s now turn to a couple of other columns that raise important points.
First, Lorraine Ali wrote a piece for the L.A. Times that captures the left’s upside-down morality. Here’s some of what she wrote.
California helped make them among the richest people in the world. Now they’re fleeing because California wants a little something back. The proposed California Billionaire Tax Act has plutocrats saying they are considering deserting the Golden State for fear they’ll have to pay a one-time, 5% tax, on top of the other taxes they barely pay in comparison to the rest of us. …it’s disturbing to think that some of the richest people in the nation would rather pick up and move than put a small fraction of their vast California-made — or in the case of the burger chain, inherited — fortunes toward helping others who need a financial boost.
I can’t resist four comments on her vapid column.
First, a 5 percent wealth tax can easily translate into a 100 percent-plus tax rate on actual income from capital.
Second, this wealth tax would be devastating for entrepreneurs with paper wealth but relatively little cash flow.
Third, California didn’t make these people rich. It’s the other way around. California has been lucky that lots of highly skilled people created businesses in places like Silicon Valley.
Fourth, I suspect Ms. Ali has no clue what it will mean when California loses the other types of tax revenue generated by these taxpayers.
I assume Ms. Ali is an ideological leftist. She’s probably well-meaning, but doesn’t understand economics, wealth creation, or much else about the real world.
But let’s close today’s column by looking at the main sponsors of the referendum. I view the Service Employee’s International Union as run-of-the-mill “rent seekers.”
They want the state to have more money so that their members can continue to earn above-market salaries.
So what will happen when their cash-grab backfires and they realize the state has lost tax revenue because of out-migration?
Billionaire exodus was not the stated goal of the wealth tax proponents: it was an unintended consequence of the ballot language drafting and revision process. SEIU-UHW is a veteran of ballot measure warfare… The fiscal impact of the billionaire exodus is hard to assess. While they are already subject to California’s top 13.3% personal income tax rate, many (or most) utilize tax avoidance strategies like borrowing against appreciated stock rather than selling it. The Legislative Analyst’s Office put the potential state income tax revenue loss at hundreds of millions of dollars per year, but LAO made its estimate before the exodus began. …If California’s share of tech workers drops (faster than it already is), income tax receipts will be severely impacted. Considering that the top 1% of earners already account for close to 40% of the state’s personal income tax, the loss of hundreds of highly compensated software engineers could have a material impact on state finances. In conclusion, it seems that SEIU-UHW should have been more careful… If it does, California state government will have less money to pay their member’s salaries and cover its other priorities.
And less money for all the other interest groups feeding at the public trough.
So I can imagine when the pro-spending lobbies get together for their strategy sessions, the union bosses are probably getting lambasted by the other moochers. Just imagine what is being said:
This doesn’t mean he’s part of the moderate GOP establishment, like Bush and Romney. But it does mean that there is considerable overlap in terms of supporting bad policy, as indicated by my last two columns.
Yesterday, I wrote about his protectionism leading to a weak job market.
The previous day, I wrote about his embrace of Bernie Sanders-style price controls.
Today, let’s look at another example of Trump-style statism. During his first term, I pointed out that he was in favor of easy-money policy at the Federal Reserve.
He’s now gone nuclear in his quest for loose monetary policy, using a very flimsy pretext to threaten Fed Chairman Jerome Powell with a criminal indictment (for details, see reports from Reuters, AP, and WSJ).
I was trying to think of a way to explain why Trump’s approach is wildly wrong. But then I saw a tweet from Prof. Justin Wolfers that perfectly captures my concerns.
And his example of Turkey is spot on, as I wrote back in 2023. If you give a populist control of monetary policy, it’s a sure-fire recipe for inflation.
In a column for National Review, Jeffrey Blehar warns that Trump is going down a very bad path. Here are some excerpts.
Trump wants lowered interest rates and “loose money”; Powell (as well as nearly every single economist in America, including the vast majority of conservative economists) feels otherwise after the runaway inflation of the Biden era. …Trump demands a political Band-Aid to cover up the self-inflicted wound; Powell serves the nation, and not Trump’s immediate political desires. …What the Trump administration is doing here is pure thuggery, lawfare of the most shameless and self-disgracing sort. What defense does MAGA wish to offer for Trump threatening to indict the chairman of the Fed on fake charges because he won’t cut interest rates like Trump demands? …It’s frightening to see a methodology shaping up in the Trump DOJ’s nakedly political indictments. This is now the second time they have moved against a disliked political figure by sifting through random Senate testimony to find something they can hang a flimsy indictment on. It is precisely the brand of injustice we all learned to revile from the Stalinist era: “Show me the man, and I will find you the crime.” …The cost of the politics of this era will be felt long after Trump is gone. I fear we will never get the poison fully out of our blood.
Since I’m a policy wonk, I want to make a broader point. As such, I’ve created this very simple spectrum to help illustrate different approaches to monetary policy.
On the right end, you have the libertarian fantasy of competitive currencies, known in the academic world as free banking. Then you have various rules-based systems (such as inflation-rate targeting and price-level targeting), with the gold standard being the most rigid.
On the left end of the spectrum, you find the most irresponsible approach, where politicians use the printing press to finance deficit spending. Zimbabwe and pre-Milei Argentina are examples.
The problem with Trump’s preferred approach is that the sugar high of easy money is only temporary. It is followed by negative effects, such as rising prices and/or asset bubbles.
When politicians get involved, it is always possible to go from bad to worse. And that’s what Trump wants, which puts me in the uncomfortable position of defending a bad Fed Chairman because the replacement surely would be worse.
P.S. I’ve analyzed two academic studies on populist economics (here and here), and both found that higher inflation is one of the negative effects.
To summarize, I pointed out that Trump thinks trade deficits are terrible and I then showed that trade deficits increased in both 2025 and during his first term following the imposition of protectionist policies.
Today, let’s look at an economic variable that does matter.
Here’s a chart shared by Marc Short. As you can see, ever since Trump imposed big tax increases on global trade, job numbers have gotten worse.
But what about manufacturing jobs? Was Trump at least able to protect America’s industrial base, which is a reason why some people defend Trump’s protectionism?
Here’s another chart, this one shared by Mark Perry. As you can see, manufacturing jobs have fallen ever since Trump launched his protectionist jihad.
I suppose it is possible that these job numbers (both overall and for manufacturing) are just statistical blips. But we’re approaching one year of data, not just one or two months.
Though it probably is indirectly connected with protectionism.
“Affordability” has become a big issue, in part because Trump’s corrupt and misguided trade taxes have raised the prices of many goods and also made the economy less efficient and productive.
He’s right that Trump’s proposed price controls – if enacted – would hurt millions of Americans.
Though I don’t think he’s the “most socialist and economically illiterate president” in the modern era. Nixon was worse, in my not-so-humble opinion, and LBJ, Obama, and Biden also were bad, as were both Bush presidencies.
The way I would categorize him is that Trump is the “most prone to vapid populism” of any president in my lifetime, with Obama perhaps giving him a close race.
I’ll close today’s column by recycling this clip from two years ago. The specific issue being discussed was whether demagogic politicians would restrict late fees on credit card payments, but the negative consequences are similar to what Trump is now proposing.
P.S. If you want broader analysis of why price controls, click here, here, and here.
In 2016, here’s some of what I wrote about the economic outlook in Illinois. And I shared the same observation when writing about California in 2018.
There’s a somewhat famous quote from Adam Smith (“there is a great deal of ruin in a nation“) about the ability of a country to survive and withstand lots of bad public policy. I’ve tried to get across the same point by explaining that you don’t need perfect policy, or even good policy. A nation can enjoy a bit of growth so long as policy is merely adequate. Just give the private sector some “breathing room,” I’ve argued.
Today, I’m again sharing Smith’s observation and applying it to the United States because I’m going to make a Goldilocks-type observation about American prosperity.
Simply stated, the United States could be growing much faster if we had better policy. That’s why I spend so much time complaining when politicians (from both parties) do foolish things to increase the size and scope of government.
But I also recognize that there’s still a decent amount of economic freedom in America. Especially when compared to the rest of the world.
So the United States is not Germany or Japan, with weak growth. Or Italy or Finland, with no growth. And we’re definitely not Venezuela or Iran, with absolute economic decline.
Though the Goldilocks analogy is inadequate because she wanted to be in the middle, with the porridge not too hot or too cold, and the bed not too hard or too soft. By contrast, I want fast growth. Not in the middle with weak growth or no growth (and I obviously don’t want economic decline).
I apologize for the long introduction to today’s column, but I want readers to understand I’m not a Pollyanna/optimist or a Cassandra/pessimist.
And those caveats are important when looking at some new research from Stephen Rose and Scott Winship at the American Enterprise Institute, which debunks the claim that the average household in America has lost ground in recent decades.
Here’s he most important chart from their study, which shows a clear upward trajectory in inflation-adjusted family incomes.
Here’s some of what they wrote.
Populists on both the political left and right routinely claim that the middle class has been hollowed out. …Using an absolute definition of the middle class, we find that the “core” middle class has shrunk, but only because more families have become upper-middle class over time. The upper-middle class boomed from 10 percent of families in 1979 to 31 percent in 2024, and its share of income doubled. The share of families whose income left them short of the core middle class fell from 54 percent to 35 percent. Claims of a hollowed-out middle class wrongly reinterpret widespread (if unequal) gains across the income distribution as rising insecurity and declining living standards. …Decrying a shrinking or hollowed-out middle class is just a gloomy way of saying the upper-middle class has boomed and fewer families are in hardship.
To augment the last portion of the above excerpt, here’s their chart showing the the biggest change in recent decades is that there are a few more rich people and a lot more upper-middle class people.
The bottom line is that there is mobility in the United States, and it’s mostly upward mobility, as I’ve argued in the past. And John Stossel and Russ Roberts (twice) have also weighed in on this issue. The U.S. is doing okay, but we could be doing better.
P.S. I invite readers to peruse the earlier columns in this series (2021, 2024, and 2025).
I’m not against international cooperation, per se. It’s simply a question of whether a bureaucracy is a net plus for economic liberty.
As a result, I’m largely sympathetic to the World Trade Organization. It has helped to reduce taxes on cross-border trade.
But the same can’t be said about the OECD, IMF, and UN. These bureaucracies seek to strengthen government at the expense of the private sector.
That’s the bad news.
The good news is that the Trump Administration is very skeptical about the merits of some of these organizations. And he’s acting on those feelings.
Adam Taylor has a report in the Washington Post about Trump’s
The Trump administration announced Wednesday that it will withdraw the United States from dozens of international organizations and bodies associated with the United Nations as Washington retrenches from global cooperation on everything from climate change to cotton. In total, according to the White House, the United States will withdraw from 66 organizations or bodies. Of that number, 31 are entities associated with the United Nations. The White House said in a statement the U.S. will withdraw from the bodies and halt any funding because they “operate contrary to U.S. national interests, security, economic prosperity, or sovereignty.” …Among the notable organizations that the United States will leave is the Intergovernmental Panel on Climate Change (IPCC), a scientific body for global climate research and policy guidance. It will also withdraw from the Global Forum on Migration and Development, an organization that helped develop a 2018 United Nations compact on migration that Trump administration officials rejected as an infringement on sovereignty during his first term. The U.N. Population Fund, the main agency supporting worldwide reproductive health and rights, also appeared on the new list of withdrawals. …Rubio, who oversaw the dismantling of the United States Agency for International Development last year, said that the United States was taking aim at the “NGO-plex” and the “elite networks” who ran it.
All of this is great news.
But the news is also very disappointing because the bureaucracies that do the most damage to the global economy – the OECD and IMF – are not on the list.
There is no redeeming quality to the OECD. It pushes for global tax harmonization and promotes tax-and-spend fiscal policy. Not in every instance, to be sure, but the Paris-based bureaucracy is clearly a net negative. It advocates bad policy in every corner of the globe.
The bottom line is that Trump has moved the ball in the right direction, but it is frustrating that the two worst bureaucracies emerged unscathed.
I’ll close by assigning blame to the Treasury Department. I don’t have any inside knowledge of what’s happened in recent months, but I know from battles during the Bush years and during Trump’s first term that Treasury bureaucrats were unfortunately effective at manipulating the the people that Bush and Trump appointed to senior positions.
Part of the problem is that career bureaucrats lean left. And some of those Treasury bureaucrats probably aspire to eventually landing a sinecure at the OECD or IMF (where they receive lavish, tax-free salaries). So it’s understandable that they do everything they can to sabotage the president’s agenda.
Let’s hope Trump eventually takes another whack at international bureaucracies. He should definitely not be happy with the OECD since some senior bureaucrats in Paris have personally attacked him.
I pointed out in both 2016 and 2022 that the United States has the most “progressive” tax system among rich nations. In other words, compared to other developed nations, the rich in America pay the largest share of the fiscal burden.
Today, let’s look at some new research on that topic, courtesy of Canada’s Fraser Institute. The report (authored by Grady Munro, Milagros Palacios, Nathaniel Li, and Jason Clemens) reconfirms that the rich bear the biggest burden of tax in the United States.
It’s especially true in California. But, because the large fiscal footprint of Washington easily offsets the impact of state tax policies, it’s even true in Texas.
Since the report was produced in Canada, there’s a breakdown of progressivity in all the provinces. In general, Canada’s tax system also is tilted against rich.
And the same is true in nations such as Korea and Austria.
Looking at the tax systems that don’t target the rich (at the bottom of Figure 6), many readers won’t be surprised to see that nations in Eastern Europe have low levels of progressivity. But how many would have guessed that there is very little bias against the rich in Scandinavian nations such as Sweden, Norway, and Finland?
Here are some excerpts from the Fraser report. We’ll start with the methodology (if you don’t care about these details, just skip to the next paragraph).
This study measures tax progressivity at a single point in time to provide a snapshot of the relative rankings of OECD jurisdictions. …the jurisdiction with the most progressive tax system receives an index score of 10 and the jurisdiction with the least progressive tax system receives an index score of 0, while the remaining jurisdictions are scored in between. …This study measures tax progressivity for 45 jurisdictions from 33 OECD countries, for 2023. …Canada, Spain, Switzerland, and the United States all have subnational governments (at the provincial/regional/cantonal/state level) that have considerable taxing powers and impose their own personal income tax schedules. 16 This means tax progressivity within these countries can vary considerably depending on where a person is located. As such, these four countries are split up into their respective subnational jurisdictions. …This analysis utilizes three variables to measure the progressivity of each jurisdiction’s PIT system. The first variable is the percentage point difference between the top and bottom marginal statutory PIT rates, while the next two variables are the income threshold over which the top marginal PIT applies, and the basic exemption, both measured as a share of that jurisdiction’s average wage… The final two variables look at each jurisdiction’s overall tax mix. Specifically, the variables are PIT and consumption tax revenues each, as a share of total tax revenues.
Now let’s look at Fraser’s analysis of the results.
The report has a lot more details, but Figure 6 is so self-explanatory that this small excerpt will suffice.
The extent to which a tax system is progressive determines the extent to which the burden of paying taxes is concentrated on top earners within that jurisdiction. As such, these results suggest that jurisdictions such as California and Newfoundland & Labrador shift a greater share of the tax burden onto those earning higher incomes, while other less progressive jurisdictions like Hungary and Estonia spread more of the tax burden onto those earning middle and low incomes. …It is worth noting the extent to which the Canadian and American jurisdictions are more progressive than European jurisdictions. Indeed, every Canadian and American jurisdiction ranked higher than nearly every European jurisdiction.
Now I’ll add my two cents, looking at the issue from an American policy perspective.
First, a political point. America’s class-warfare politicians are a motley collection of liars, know-nothings, and demagogues. They endlessly bleat that upper-income taxpayers “don’t pay their fair share,” yet the U.S. tax system is the most progressive in the world when looking at developed nations.
Second, the study is only measuring the degree to which taxes are paid by various income groups, not the overall weight of the tax system. The key thing to understand is that the U.S. system is very progressive not because the rich are paying very high rates, but rather because lower-income and middle-class taxpayers are paying very low rates.
To elaborate on the second point, imagine a tax system that was nothing but a 10 percent flat tax on million-dollar-and-up incomes. That would be a hyper-progressive tax code (i.e., every penny of tax paid by the rich), but it also would be a tax system that would make everyone better off compared to today’s punitive system.
So it’s not that progressivity is the defining characteristic of a bad tax code. It’s high tax rates that cause damage, as I’ve noted in my two-part series (here and here). And if you want to see how nations rank on that basis, I have columns from 2014, 2017, 2019, and 2023.
One final point is that the difference between the U.S. and European welfare states is not taxes on the rich (upper-income taxpayers get squeezed on both sides of the Atlantic).
The real difference is that lower-income and middle-class taxpayers are pillaged in Europe and taxed lightly in America.
The above table is my adaption from a report by U-Haul. The truck rental company analyzes the flow of one-way rentals throughout the nation.
They don’t draw any conclusions, which is why I augmented their data with some of my observations (2025 tax rates in green).
Here’s some of what is in the company’s report.
Texas and Florida lead the list of in-migration states on the U-Haul® Growth Index analyzing one-way customer transactions during 2025, while California ranks last with the greatest out-migration number for the sixth consecutive year. Texas reclaims the title of No. 1 U-Haul growth state for the seventh time in 10 years. It climbs one spot from its previous ranking behind South Carolina, which slides four spots after being the leading growth state for 2024. Florida, North Carolina and Tennessee follow Texas as prime destinations. It’s the same top five from 2024 and 2023, although in a different order. The top 10 also includes Washington, Arizona, Idaho, Alabama and Georgia. While California’s exodus of do-it-yourself movers was greater than any other state, it saw a smaller net loss in 2025 than in 2024. Massachusetts, New York, New Jersey and Illinois also rank among the bottom five on the index.
Some people may be tempted to dismiss the U-Haul numbers as being unscientific. I think that’s a mistake since we now have years of data and a very large data set.
But for those who prefer academic rigor, Professors Traviss Cassidy, Mark Dincecco, and Ugo Antonio Troiano produced a study last year looking at a century of data about income taxes and migration.
Lo and behold, they conclude that people have voted with their feet.
…this paper…analyzed the…introduction of the income tax – using a new panel database that covers the entire twentieth century and the start of the twenty-first century across U.S. states. Our empirical strategy exploits the staggered adoption of the income tax over a 65-year period, and accounts for selective timing of adoption based on recent demographic and fiscal trends. We find that the introduction of the income tax increased total revenue per capita in the near run, medium run, and the long run for both early (i.e. pre-World War II) and late adopters (i.e. post-World War II), while total revenue in absolute levels increased in the medium or long runs for early adopters, but not for late adopters. We explain the fiscal results by showing that the introduction of the income tax by late adopters reduced state populations in the long run, as residents relocated to states that did not have the income tax. We find that both middle- and high-earning households exhibited strong migration responses.
For those who like visuals, here’s a chart from their study.
One big takeaway is that people in recent decades have been more willing to escape high state taxes.
P.S. Here’s a map from their report, showing when income taxes were first imposed.
The good news is that no state has been foolish enough to impose an income tax in recent decades (though the state of Washington is already a bit pregnant in that direction). Also, both Tennessee and New Hampshire now qualify as zero-income-tax states since they got rid of their levies on capital income. And the map is wrong in that Connecticut foolishly enacted on income tax in 1991.
The program is sponsored by UCEMA (University of the Center for Macroeconomic Studies of Argentina) and starts March 16 and has a relatively modest price tag.
I encourage people to sign up, but not because I will be one of the lecturers. What’s happening in Argentina is profoundly important. A complete vindication of hard-core free-market policy.
By the way, this is a labor of love for me. I’m not getting paid for my efforts.
Instead, my participation is part of the Center for Freedom and Prosperity’s new project on Latin American Liberty. The Center started this project because there are so many key developments happening in that region.
Speaking of Mexico, the other announcement today is that I’m in Mexico City because I am now a visiting professor at Universidad de la Libertad. This afternoon, I’ll be teaching my first class on Foundational Principles of Economics to a class of lucky students.
Or maybe not so lucky. We’ll see what happens.
P.S. I’m not giving up on economic liberty in North America (though Canada seems hopeless) And I’m not giving up on Europe (where good places like Switzerland offset basket cases such as France). Or the rest of the world, for that matter. I’m simply saying that Latin America is where big things are happening
The Center for Freedom and Prosperity released this video back in 2010, but I don’t think I’ve re-shared it since 2016, so let’s begin today’s column with a reminder that it is possible to have a simple and fair tax system.
But since I’m an economist, I couldn’t resist pointing out in the video that it’s also important to have a tax system that does not needlessly penalize and undermine prosperity.
But it can also mean looking specifically at the damage of “progressive” tax rates. In other words, what are the adverse consequences of a tax system that punishes people with ever-higher tax rates if they contribute larger and larger amounts to overall economic output?
We have an answer, which builds on a column I wrote in 2021. There’s a new study by João Tovar Jalles and Georgios Karras, economists from the University of Lisbon and the University of Illinois Chicago respectively.
This chart from their study shows that an increase in progressivity reduces economic growth.
Here’s their description of the issue they addressed.
Early research, such as Barro’s (1990) influential study, argued that a progressive tax system, where higher-income individuals pay a higher percentage of their income in taxes, could negatively affect economic growth. The basic premise here is that higher tax rates on the wealthy may reduce their incentives to work, save, and invest, ultimately slowing down economic growth. Several empirical studies have supported the idea of a negative relationship between tax progressivity and economic growth. For instance, Gemmell and Hasseldine (2001) found that higher marginal tax rates on top incomes were associated with slower economic growth. The argument is that progressive taxation can discourage high-income individuals from engaging in productive economic activities. …in the present paper we investigate the effects of tax progressivity on economic activity, and so we focus on the cost side of its effects. We adopt an econometric direct estimation approach and rely on a data set that covers 33 advanced economies since 1980.
And here are the key findings.
…we show that tax progressivity is negatively related to growth of output per capita in the full panel data set. The result remains valid when the tax rate is controlled for – and in fact the effect of progressivity is often strengthened by adding the tax rate in the regressions. Next, when we turn to the dynamics using a Local Projections methodology, we find that an increase in tax progressivity lowers the growth rate of real GDP per capita temporarily, and its level permanently. Both effects are consistent with the theoretical predictions of the standard neoclassical growth model, sizable, statistically significant, and robust. Quantitatively, our estimates suggest that raising tax progressivity from US to Portuguese (or from Japanese to Swedish) levels retards the real GDP growth rate for 4-7 years, the negative effect peaking at 0.5% to 1% slowdown in the growth rate three years after the shock.
For what it’s worth, I’m most worried about the reduction in long-run economic output (even small changes in long-run growth matter a lot), though obviously it’s also not good to suffer short-run losses.
Some of you may be thinking this research a quantification of common sense.

In particular, the percentage of total income that is accounted for by money income decreased from 1979 to 2021… In 1979, money income accounted for nearly two-thirds of total income, and in-kind transfers (both health-related transfers and those unrelated to health) accounted for about one-third. In 2021, money income accounted for about one-quarter of total income, and in-kind transfers accounted for more than half.

 There’s one other visual from the CBO report that I want to share, mostly because it underscores the wisdom of the late Walter Williams.


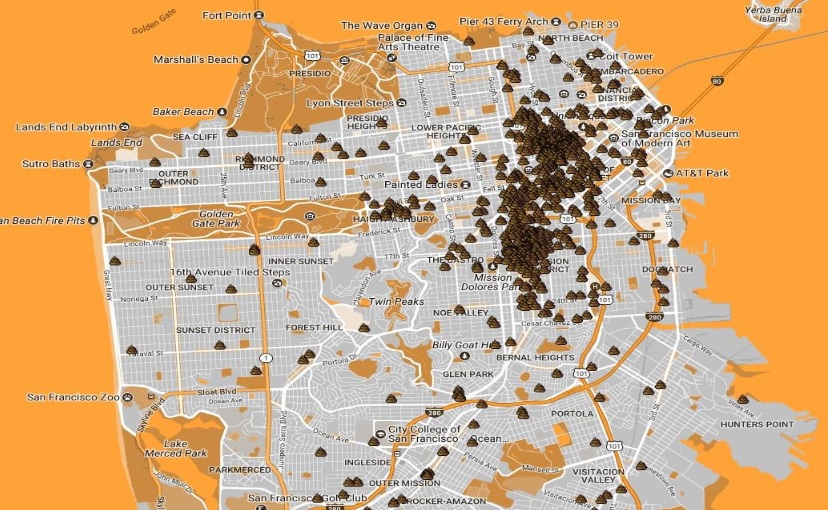


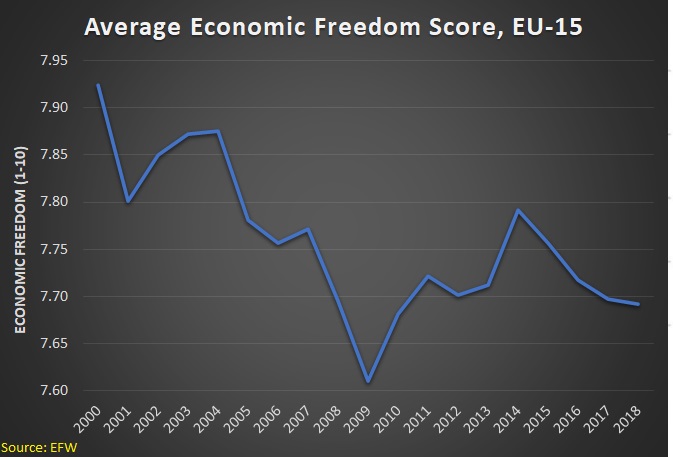


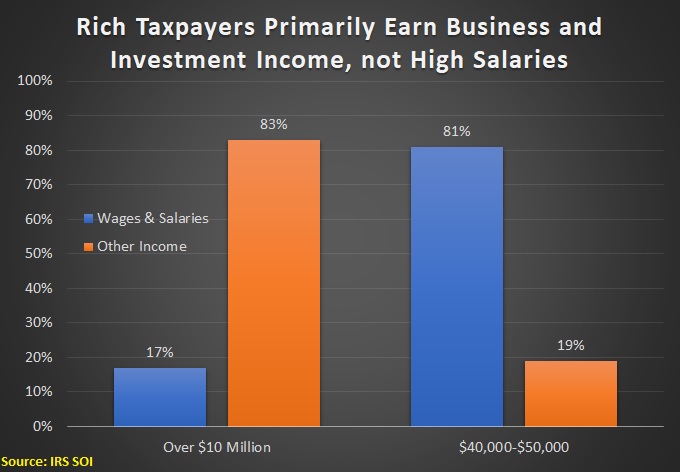


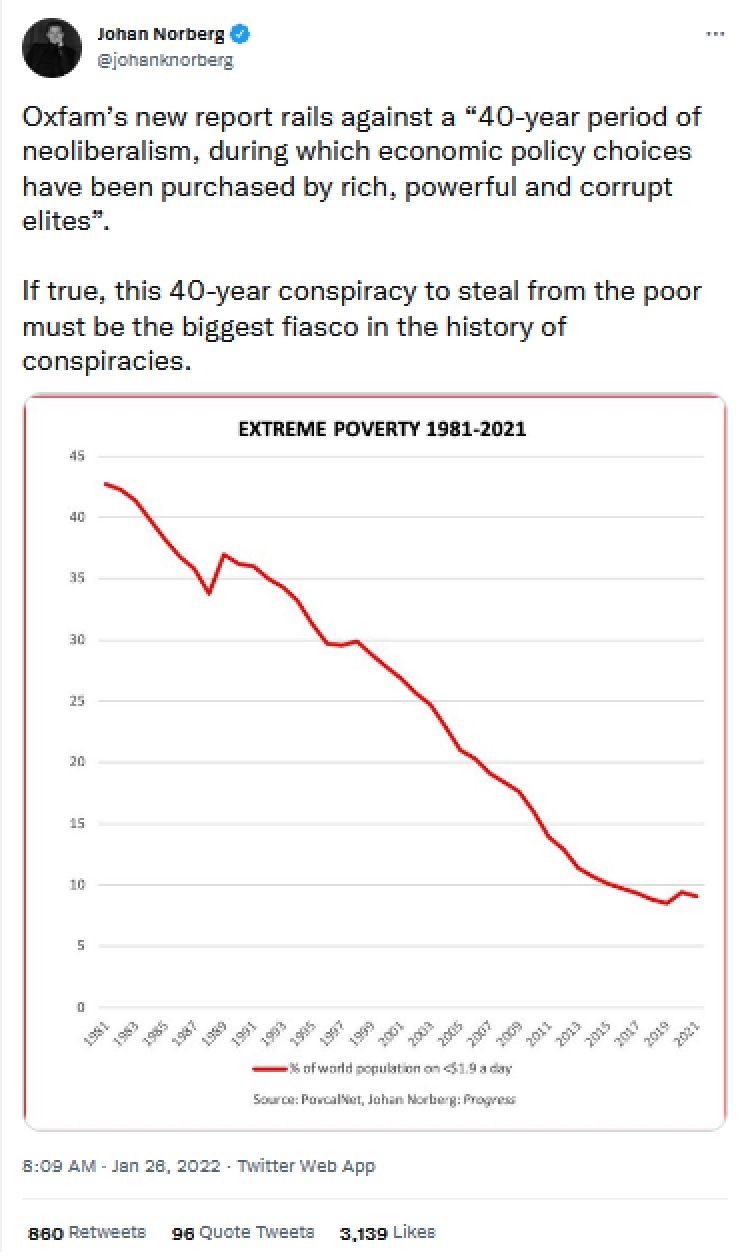


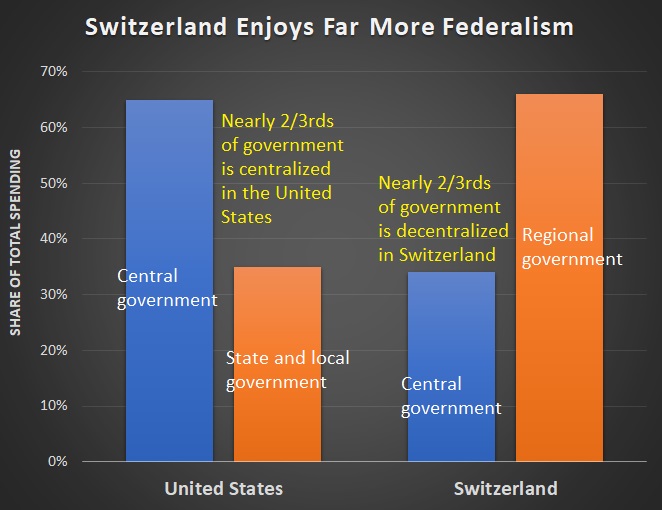


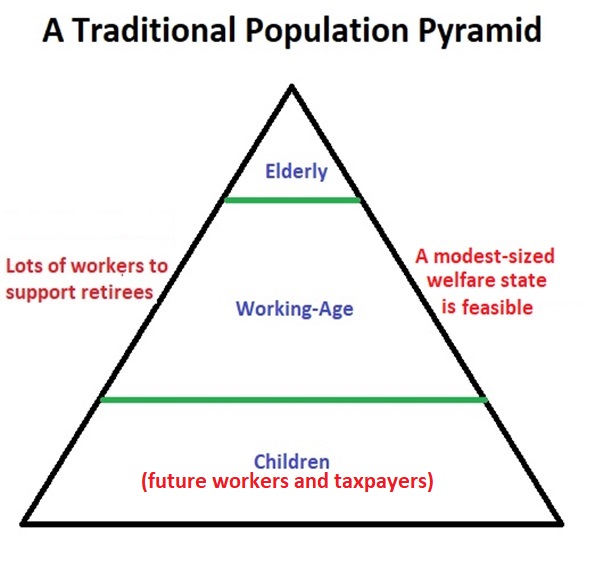
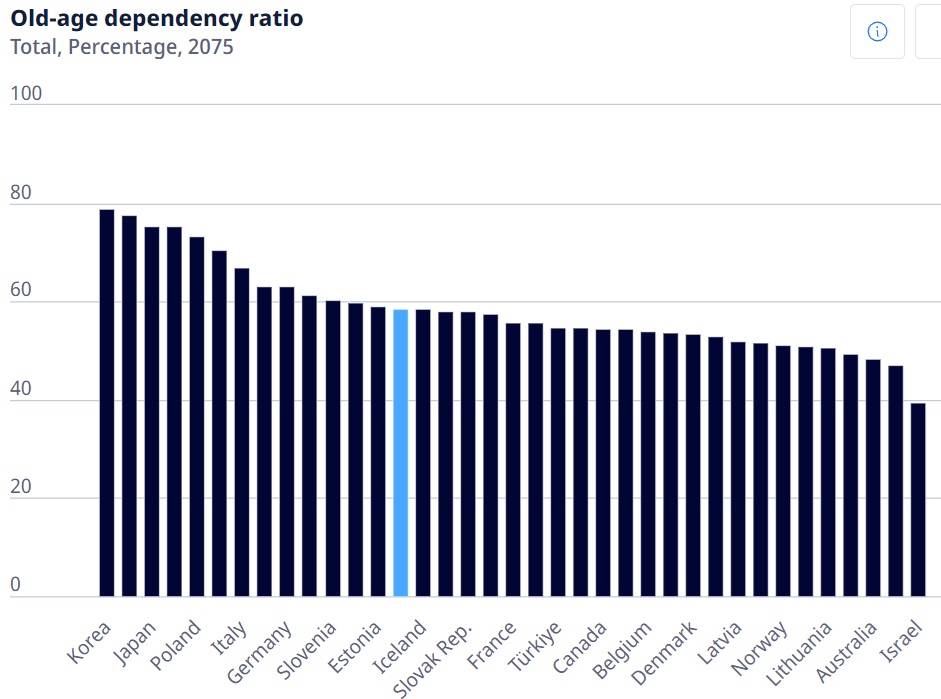


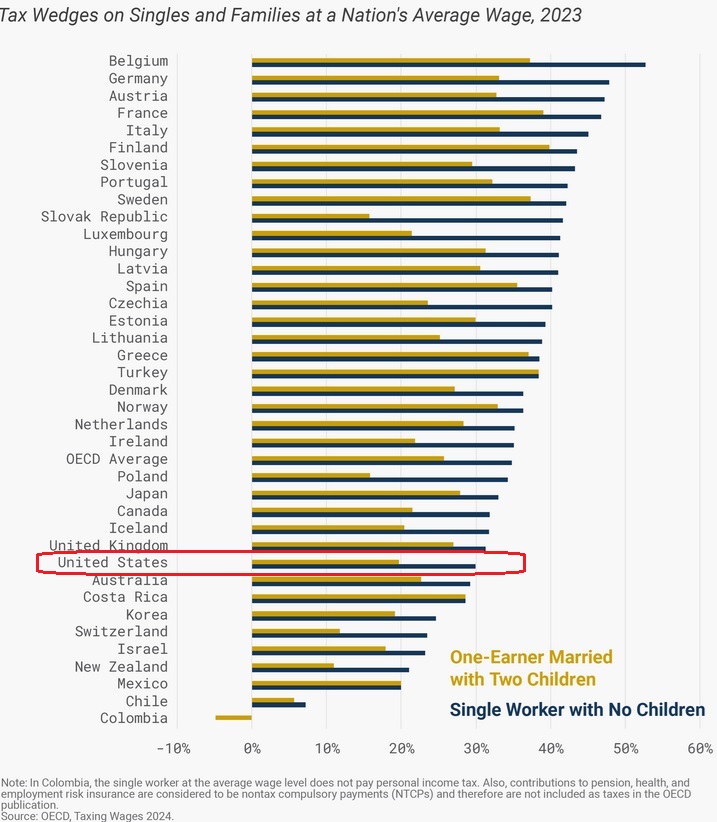


