-

AI Chart Generator Thumbnail
-
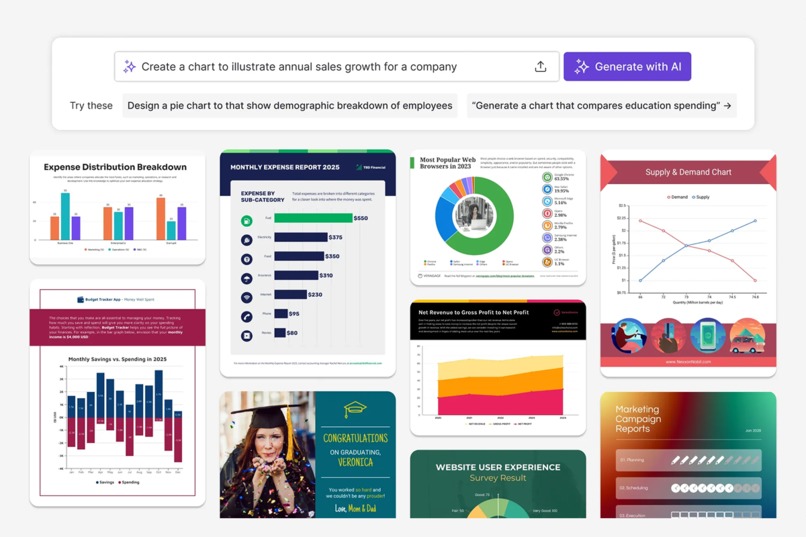
AI Chart Generator Demo


We're a passionate team of designers, developers, marketers, and builders dedicated to making design accessible for everyone. Since launching Venngage, we’ve grown into a global remote team committed to helping individuals and businesses turn ideas into beautiful, professional visuals, without needing a design background.
We believe that great communication starts with great design, and that's why we've built AI-powered tools that simplify the process for everyone. Whether it's infographics, brochures, reports, or pitch decks, we're here to make it faster, smarter, and easier for you.
The AI Chart Generator is your shortcut to clear, compelling data visualizations—no spreadsheets or design tools required. Whether you're building a business report, prepping a presentation, or tracking project performance, this tool turns your data or simple prompts into professional, fully editable charts in seconds.
How it Works: Just describe your data in plain language (e.g. “Monthly sales by region, 2024”) or paste in a dataset. The AI instantly analyzes your input, selects the best chart type—like bar, pie, or line—and generates a polished visual with labeled axes, color-coded values, and a clean layout. Every chart is editable, so you can fine-tune colors, fonts, and branding using the drag-and-drop editor.
Key Features:
- Prompt-to-Chart Generation: Input a description or data and let the AI do the rest—no design or data skills needed.
- Smart Chart Selection: Automatically recommends the best chart type based on your content for maximum clarity and impact.
- Customizable Designs: Tweak fonts, colors, icons, and layout to fit your brand or presentation style.
- Multiple Chart Types: Bar charts, pie charts, line graphs, area charts, and more—all AI-assisted.
Key Benefits:
- Visualize Data Instantly: Cut hours of manual formatting with ready-to-use visuals in seconds.
- Communicate Insights Clearly: Present complex information in a clean, accessible way that resonates with your audience.
- Stay On-Brand, Every Time: Apply your branding seamlessly to every chart without starting from scratch.
Whether you're a marketer, analyst, educator, or entrepreneur, the AI Chart Generator makes data storytelling faster, smarter, and visually stronger.


Log in or sign up for Devpost to join the conversation.