-
-
Main Page - Loading Screen
-
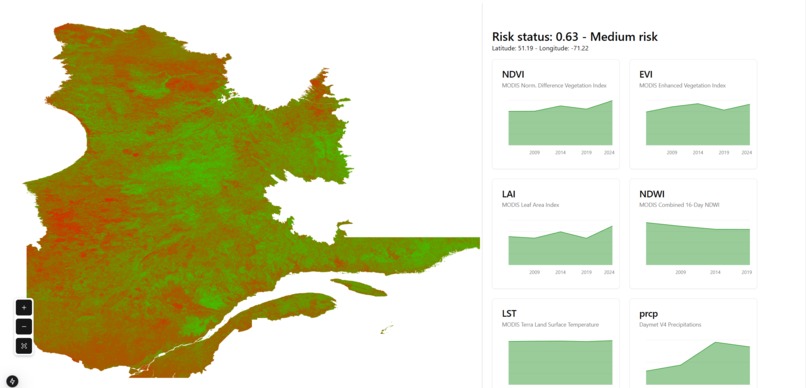
Web App
-
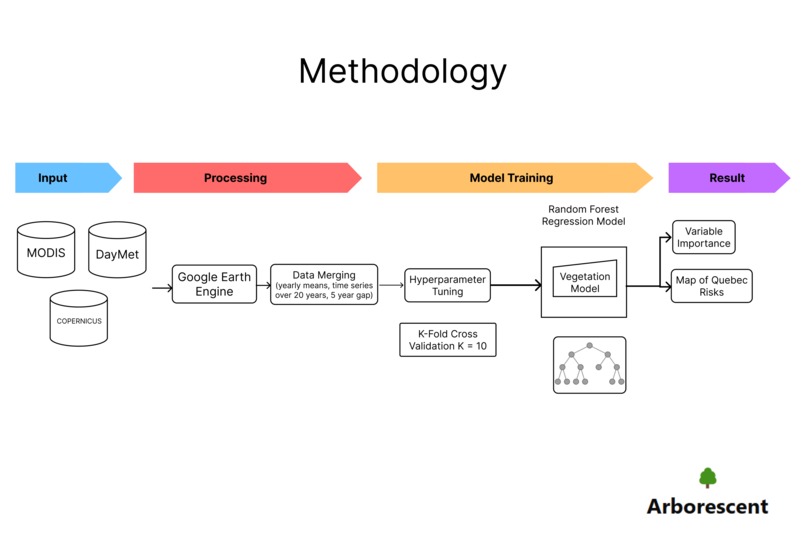
Methodology


Inspiration
Finding an idea for this hackathon was tough; we are going to be honest, we had little experience in sustainability. But we had faith in our skills.
What it does
An interactice map to assign a health index to Quebec territory based off of terrain data ranging from soil composition to proximity to mines.
How we built it
We built Arborescent using a full-stack approach:
Model: We trained a Random Forest Regression model to identify the health index of every single pixel of Quebec's map to then classify its risk category. This is done by extracting 7 time-series Google Earth Engine Satellite Imaging layers and risk data through various maps of Quebec, such as protection regions and regions with mining activity.
Frontend: We utilized React and Next.js to create a dynamic and interactive user interface. This allowed us to efficiently manage client-side rendering and provide a seamless user experience.
Backend: For the server-side logic, we employed Python. This choice enabled us to leverage Python's extensive libraries for data processing and analysis. We used Flask to handle API requests and manage data interactions.
Challenges we ran into
It was exceptionnally challenging to make the the map as interactive as it is. Implementing the .tiff file into the web app while getting cursor position and coordinates from the file itself and fetching all chart data based off of the selected pixel was truly a challenge.
Accomplishments that we're proud of
One of the significant challenges was integrating the frontend and backend components seamlessly. Ensuring that the React and Next.js frontend could effectively communicate with the Python backend required careful handling of API calls and data formats. Additionally, managing the complexity of terrain data and ensuring accurate health index calculations posed a considerable technical hurdle.
What we learned
We learned rapidly how to integrate the results of our classification model, trained in a Jupyter notebook. This challenge, coupled with coloring the map with a color gradient based on numerical data was something we are proud to have conquered.
What's next for Arborescent
We firmly believe that with enough time and support, Arborescent will support Canada-wide coverage. With new data emerging, we could further improve the accuracy of our model with new parameters.
Built With
- flask
- google-colab
- google-earth-engine
- javascript
- jupyter
- nextjs
- python
- react
- tailwindcss


Log in or sign up for Devpost to join the conversation.