-
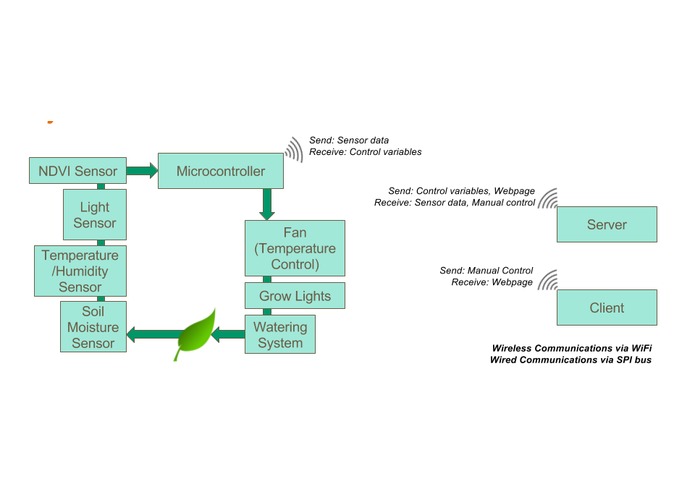
System Architecture
-
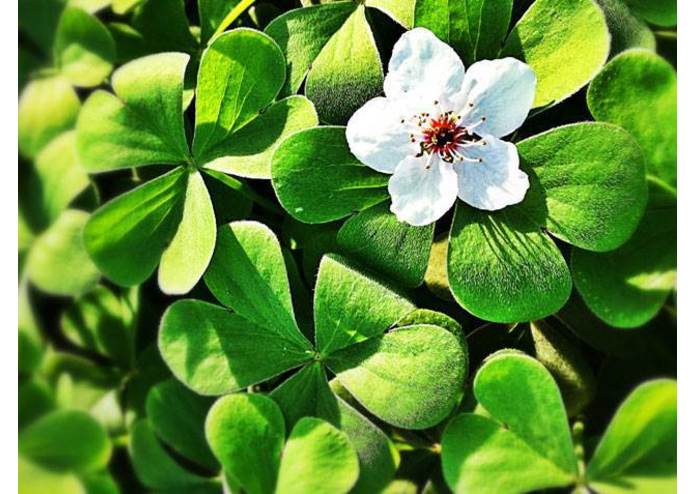
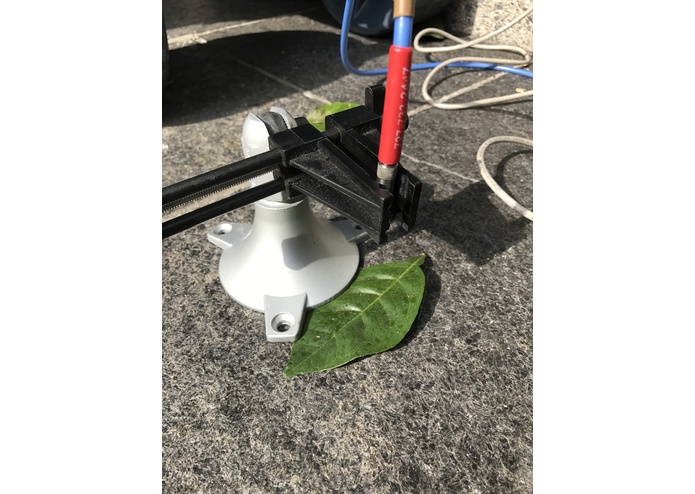
Original Image
-
Citrus Tree
-
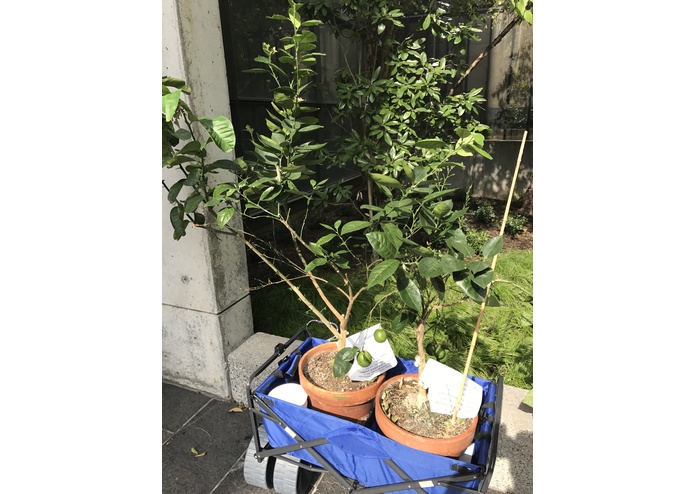
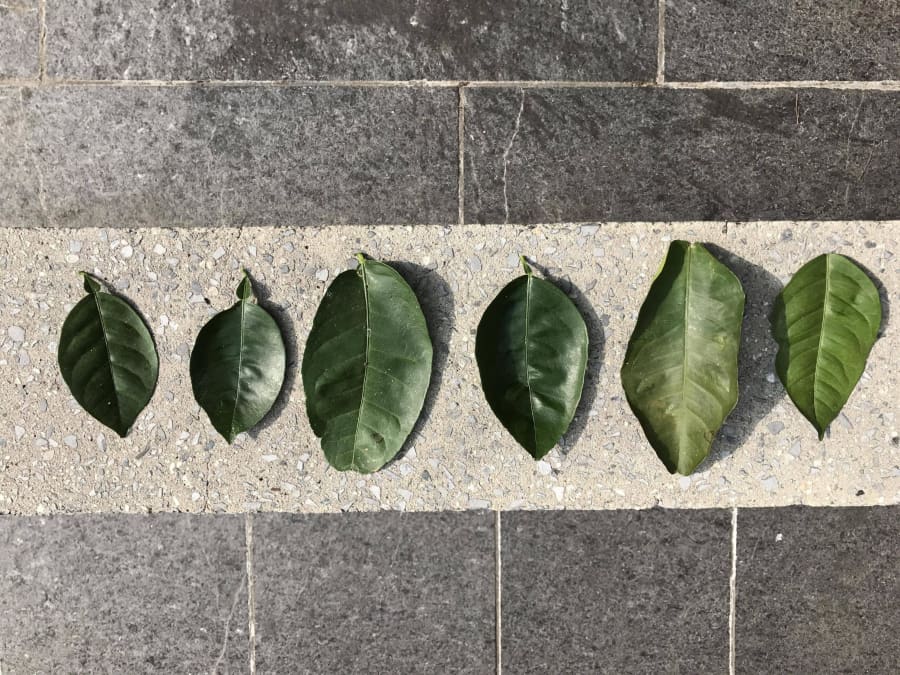
Experimental Setup
-
Experimental Setup
-
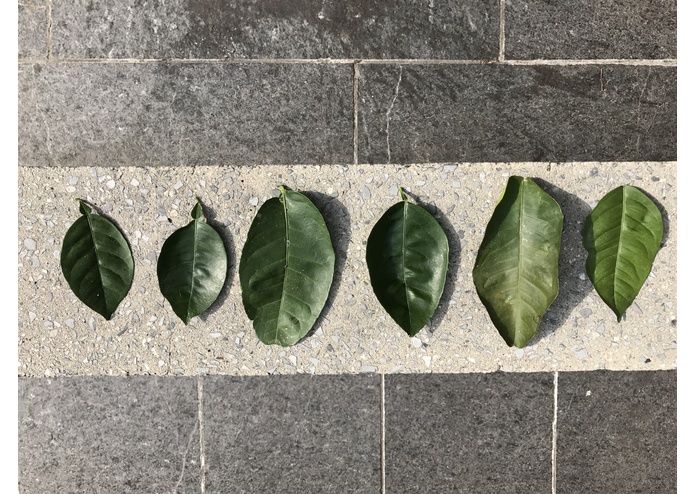
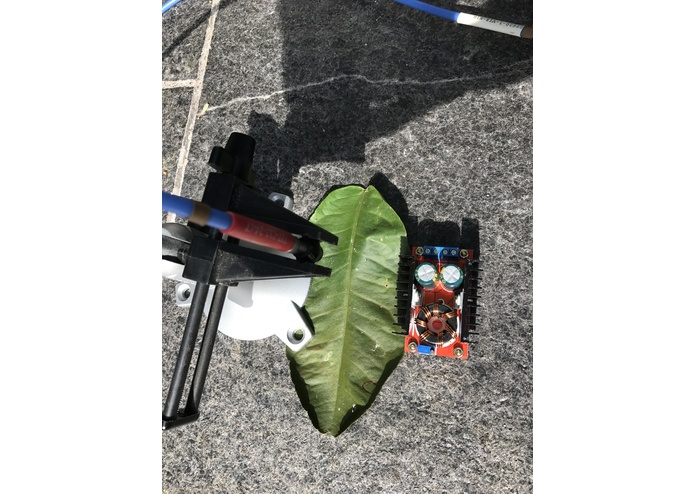
Samples
-
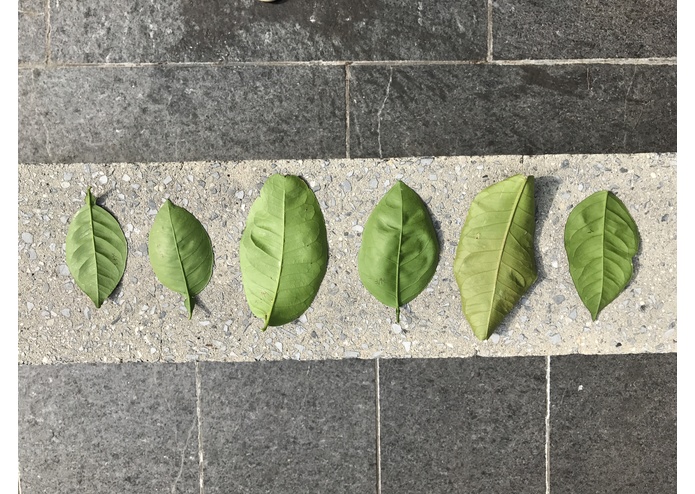
Samples


Summary:
Barn Owl aims to automate greenhouse plant care and provide users with a simple interface to monitor plants and manually control environmental conditions.
Concept:
Using the normalized difference vegetation index (NDVI) as our basis for detecting plant health, our system will follow automation regimens for specific species of plants. Soil moisture, lighting, and temperature/humidity will be monitored by the system to make appropriate changes to the environment.
Goals:
Our goal with Barn Owl is to automate a micro-farm using the existing greenhouse outside of the Skirkanich building. Several plants will be cared for automatically in the greenhouse using various sensors (temperature/humidity, lighting, soil moisture) to monitor conditions. Watering intervals, fans, and lighting will be adjusted by our system to provide optimal growing conditions. A front-end interface will be used to monitor the greenhouse and provide manual control. The front-end interface will also allow users to specify which plants are being grown in order to better tailor the conditions to the needs of a certain plant species.
System Architecture:
Please refer Fig.System Architecture
Timeline
Week of 10/16: Identify and order components; Research ideal plant regimens; identify problems with greenhouse and fix them (if needed)
Week of 10/23: Finish fixes with greenhouse (if needed); Communication between all sensors and microcontroller via SPI (or similar); HTML mockup of front-end environment; Begin soldering of protoboard if possible; build and test watering system, fan system, and lighting system
Week of 10/30: Solder prototype board and test (if needed), Finish water/fan/light system (if needed), Order enclosure and any remaining parts, Early integration – send signal from front-end to microcontroller (e.g. turn on an LED) and from microcontroller to front-end (push button makes a change on the front-end);
Week of 11/6: Integration step 2 – toggle water/fans/lighting from front end, and send the actual system state back to the front-end; Build logic to control automation regimens;
Week of 11/13: Final integration and system testing


 This was one of our first attempts at graphing live data from a Photon. We liked Node.js, but we're unsure how well it would handle some of the image processing we'll need to do for NDVI.


Log in or sign up for Devpost to join the conversation.