-
-
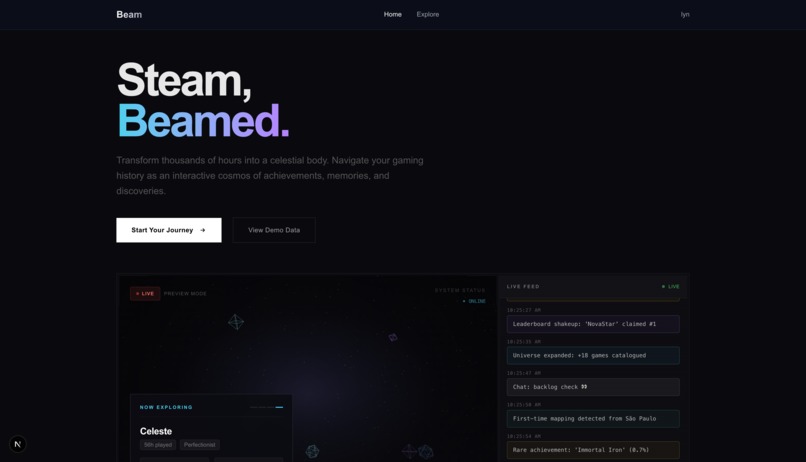
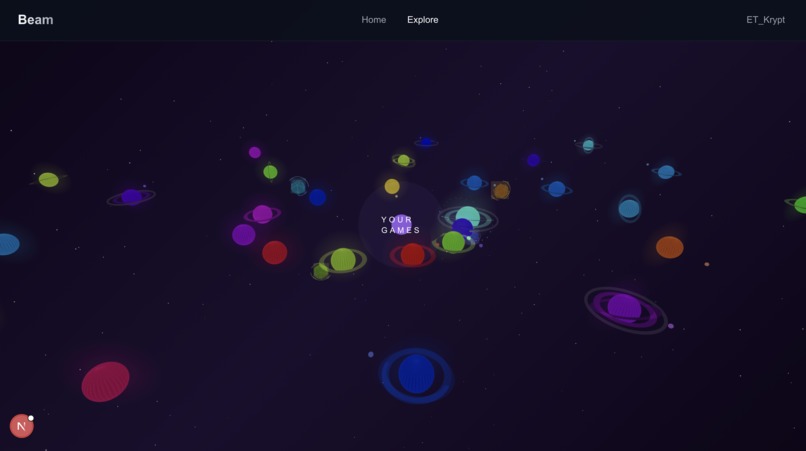
Landing page
-
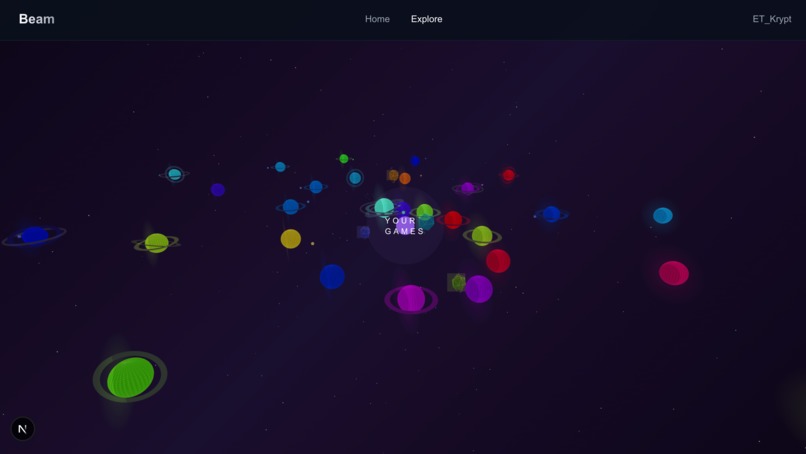
3D universe with planets as game nodes
-
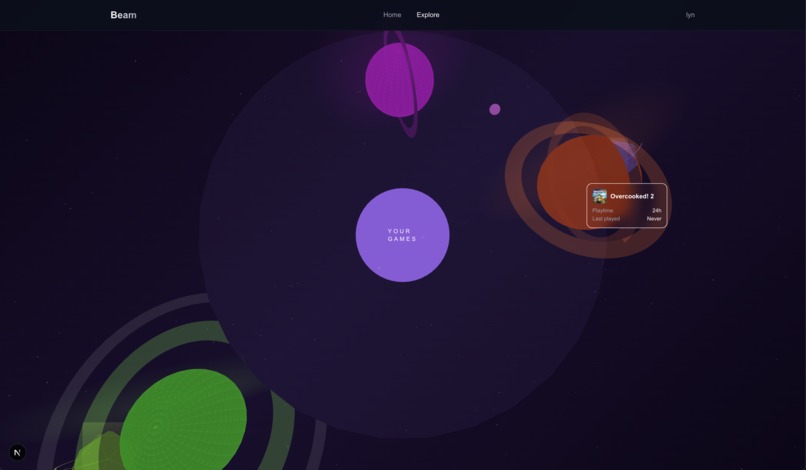
Hovering over nodes gives a brief summary
-
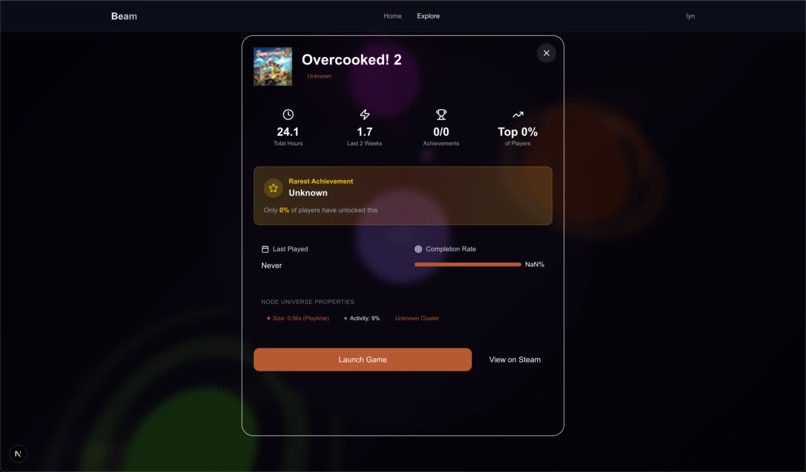
Clicking on nodes opens an expanded detail panel
-
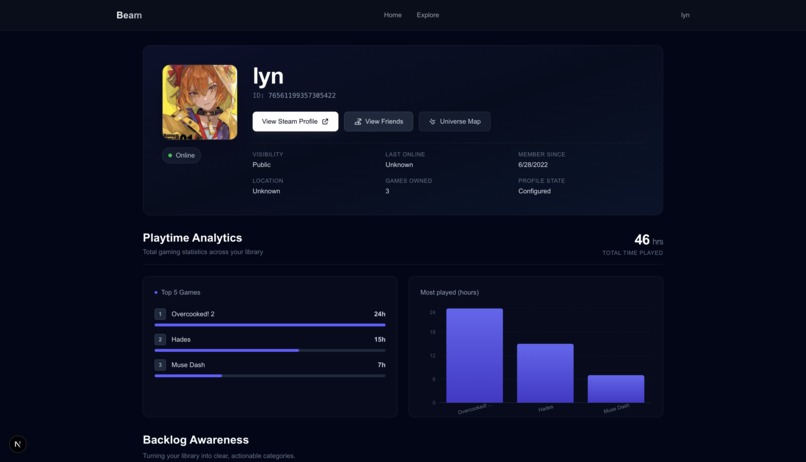
Profile with playtime stats
-
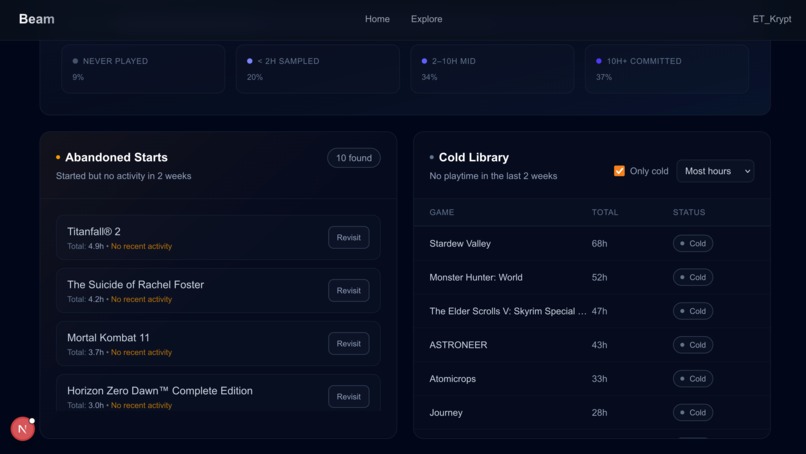
Profile with backlog data
-
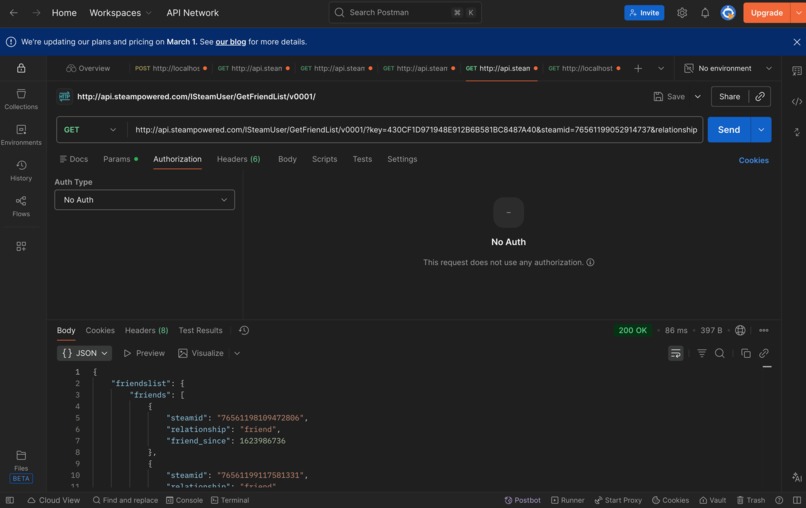
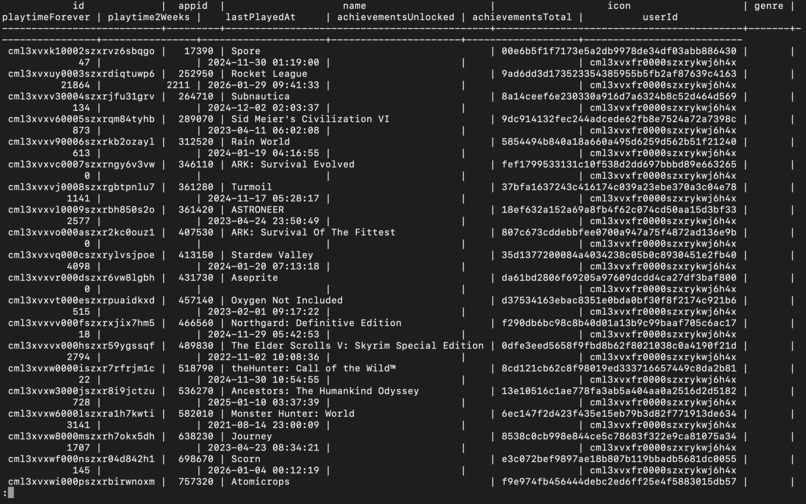
Postman API call
-
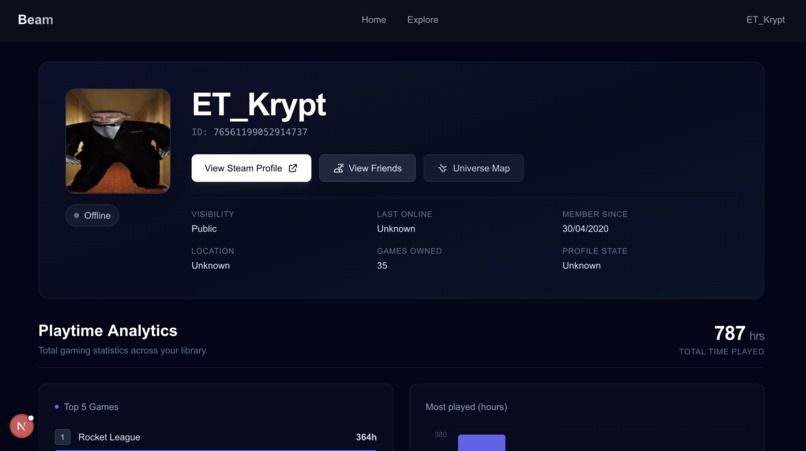
Custom profile page collected from database
-
A galaxy with around 35 games installed
-

JSON data returned by our backend api call
-
'Sync' API Calls call prisma and upload into database
-
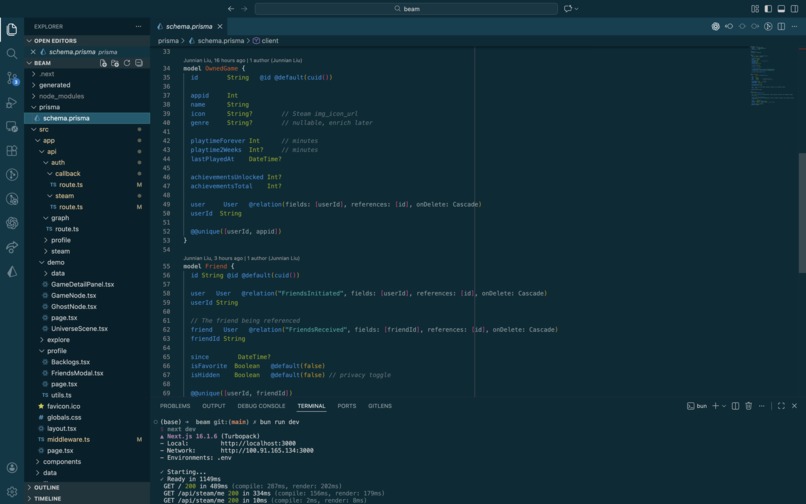
Relational Prisma Models map to postgres database
-
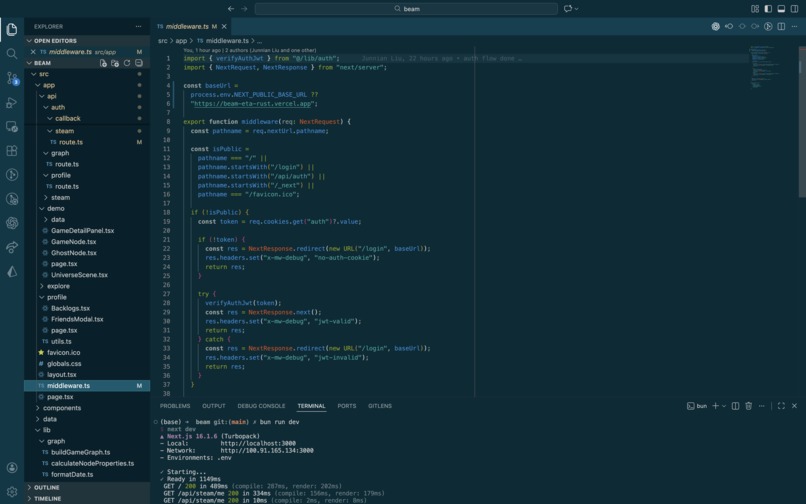
Middleware parses JWT in Https Cookie and redirects back to login page is user is not logged in


Inspiration
The gaming industry's market capitalization is massive and growing, with estimates for the total market size (revenue) reaching around $189-$280+ billion in 2025-2026. Steam dominates the global PC digital distribution market with over 132 million monthly active users. The average Steam user owns over 150 games but has no meaningful way to view them—only endless vertical lists and granular spreadsheets that obscure the story those hours tell.
What it does
Beam transforms your Steam data into a living 3D universe where every game becomes a celestial body - sized by your investment, positioned by your recency, and glowing with your achievements. Visit your profile to unlock a complete breakdown of your gaming statistics, visualize your playtime patterns, and surface the gems buried in your library. We illuminate the gap between the games you buy and the games you actually play - turning raw hours into actionable insight. Beam makes your gaming habits visible, measurable, and mindful.
How we built it
Beam maps Steam API's 2D statistics into 3D coordinates using React Three Fiber. Drei and Three.js. The frontend runs on Next.js with TypeScript and Tailwind CSS, featuring a real-time activity feed and analytics dashboard for playtime patterns, cold libraries, and abandoned games. PrismaORM and PostgreSQL allow for API caching through the database.
Challenges we ran into
A big challenge was translating Steam's flat tables of playtime minutes and Unix timestamps into a coherent 3D spherical coordinate system. For the backend, Steam's legacy OpenID 2.0 was difficult to work with, as well as later JWT and httpOnly cookie handling.
Accomplishments that we're proud of
Building an interactive 3D environment in 24 hours while keeping the UI polished and cohesive. Creating a real-time "live feed" simulation that makes the landing page feel alive. Most importantly, transforming abstract playtime data into something spatial and emotional - a universe you actually want to explore rather than a spreadsheet you tolerate.
What we learned
Three.js and React Three Fiber have a steep learning curve for data-to-visualization mapping, but the payoff is immense for user engagement. We also discovered how much visual hierarchy matters when displaying "shame data" like backlogs.
What's next for Beam
We hope to improve the current "discovery nodes" with ML-powered recommendations that suggest new games based on activity, fix game data calculations, implement friend constellation views (seeing your network as a connected galaxy), and add achievement heatmaps to visualize your accomplishments.
Built With
- neon
- next.js
- postgresql
- prismaorm
- react
- steamwebapi
- tailwindcss
- three.js
- typescript


Log in or sign up for Devpost to join the conversation.