-
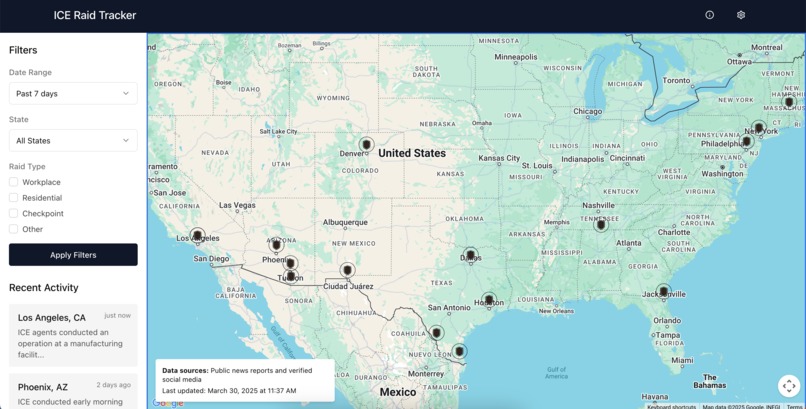
Side panel with interactive map.

Inspiration
Recent ICE raids have caused fear and uncertainty in vulnerable communities. We wanted to create a tool that aggregates and visualizes this information in real-time, helping people stay informed and safe. Our goal was to turn scattered, often hard-to-find news into accessible, actionable data.
What it does
Blizzard Warning scrapes news sources for reports of ICE raids, uses Gemini AI to extract key details like date, location, description, and then formats them into structured JSON. A web app then displays this data in two ways:
- Sidebar: Cards summarizing each raid for quick browsing.
- Interactive Map: Google Maps markers show raid locations—clicking them reveals descriptions.
How we built it
Our website primarily used React and TailwindCSS in TypeScript for front-end. Then Node.js and express in TypeScript for back-end. We first scraped the web for links related to ICE raids, then scraped those links for all text, then used Gemini AI to parse out and format the information as a JSON file. Then used this formatted data to list out recent raids and place markers on the interactive Google Map.
Challenges we ran into
As this was our first time ever webscraping, it took us few hours to implement
Accomplishments that we're proud of
We built a fully automated pipeline from scraping to formatting to visualization.
What we learned
We learned how to work with Node and Express to implement the backend portion in TypeScript and pipeline data to client side.
What's next for Blizzard Warning
Scraping social media for recent raids because social media can give us access to more recent and authentic data.


Log in or sign up for Devpost to join the conversation.