-
slide 1
-
slide 2
-
slide 3
-
slide 4
-
slide 5
-
slide 6
-

slide 7
-
slide 8
-
slide 9


Inspiration
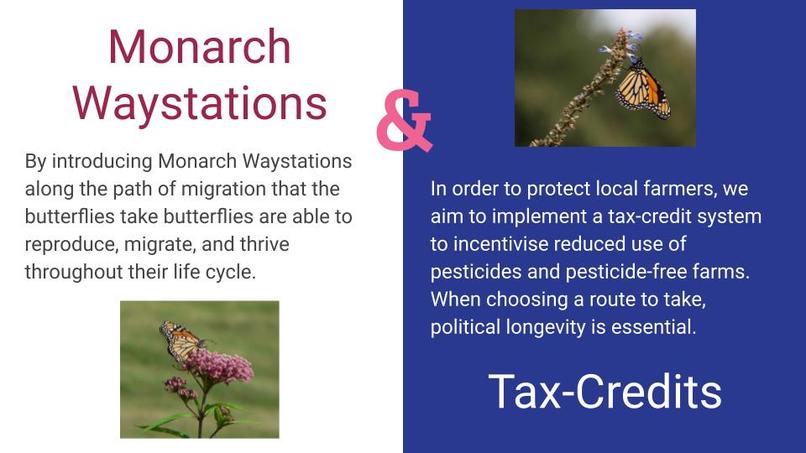
In planning out actionable responses to the decline of monarch butterflies, we came up with the idea of creating monarch butterfly waypoints in key migratory paths. Although this course of action is not the intended focus of the scenario, it created a great launching point. After trying to find pesticides that were found nationally, we realized that pesticide usage greatly depended on agricultural zones. From there, we determined that we didn't need to address the whole scope --- instead, we focused on targeting a specific pesticide that has had considerable specific impacts to state's butterfly population. Since this approach was more tangible, in addition to the waypoints, we could demonstrate a specific problem and a more achievable solution.
What it does
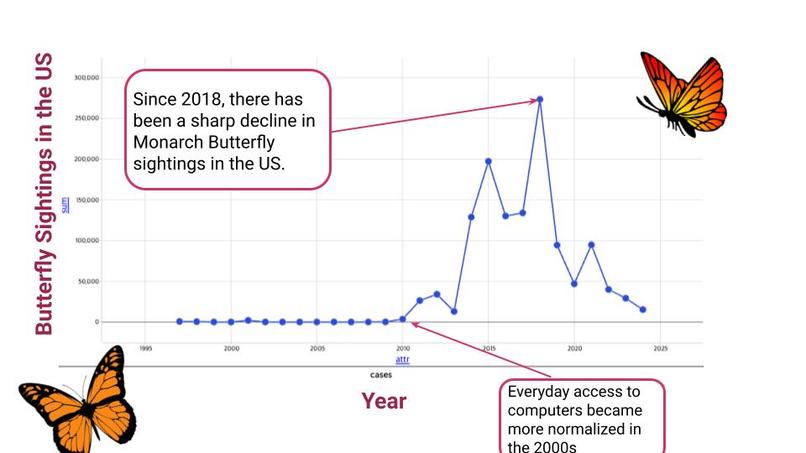
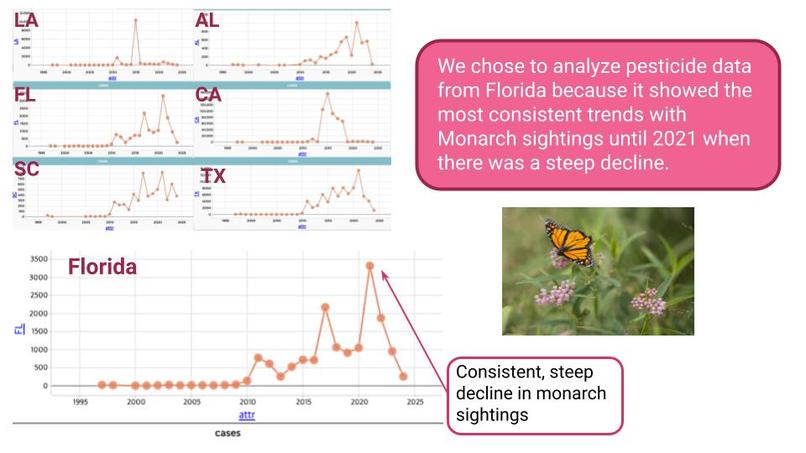
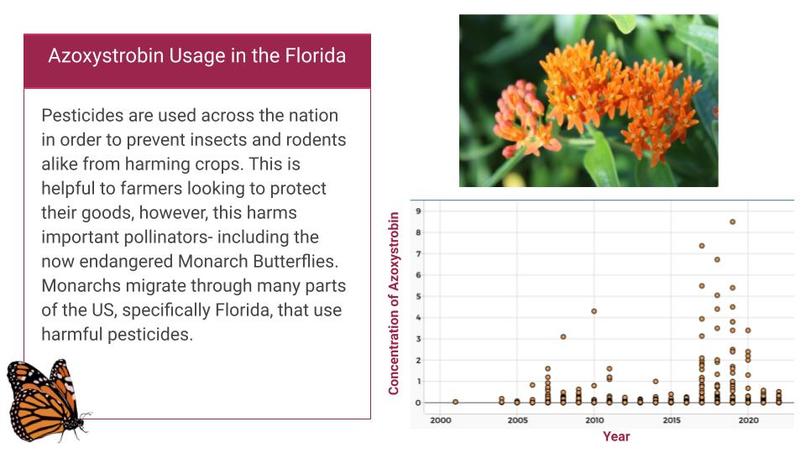
our program parses the data from the csv by state and by insecticide/pesticide, then determines which are used in the highest concentration. from there, we analyze which has had the highest effect on butterfly population. with Florida's butterfly data as our example, we analyzed growth in which insecticides and pesticides reflected the drastic decline of butterfly populations over the course of the past few decades.
How we built it
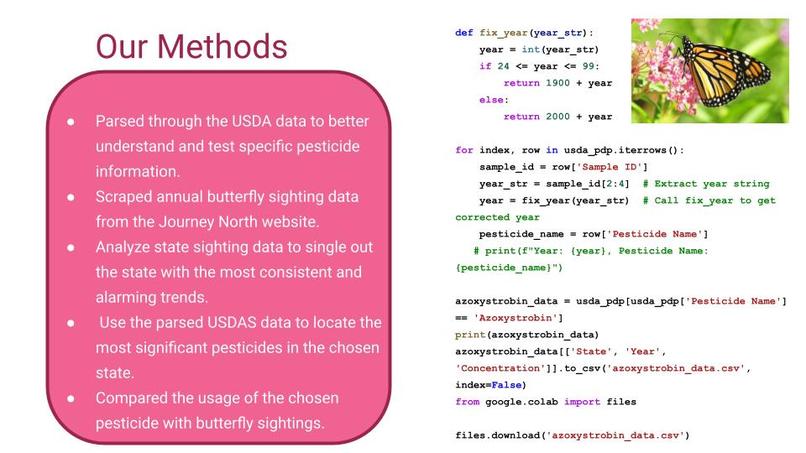
First, we used python to parse through the USDA data to better understand and test specific pesticide information. Additionally, we extracted the state and year data, and sorted it so we could test our findings over time and by state. Then, we scraped annual butterfly sighting data from the Journey North website using Python and HTML, using our findings to demonstrate the of butterfly populations nationally and by state. With visuals created with CODAP, we analyzed state sighting data to single out the state with the most consistent and alarming trends. Once we singled out a target state, we used our parsed USDA data to locate the most significant pesticides in the chosen state. Using charts generated from CODAP, we compared the usage of the chosen pesticide with change butterfly sightings over time.
Challenges we ran into
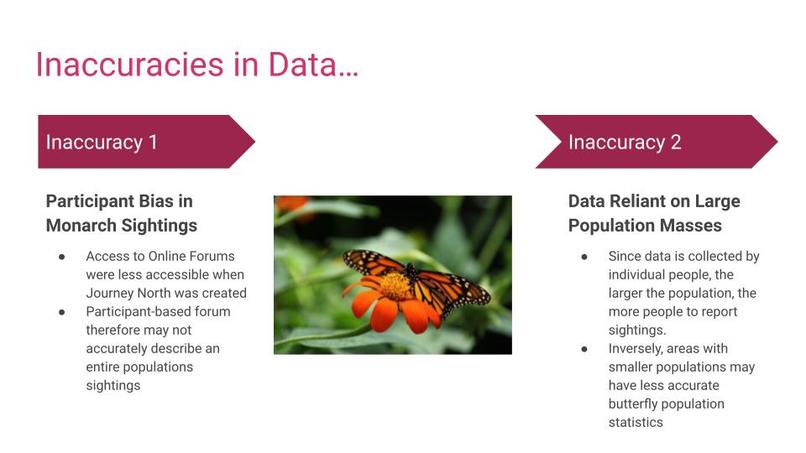
Initially, we tried to graph the entire dataset, but like drinking from a firehose, there was simply too much for us to draw any reasonable conclusions or for our computers to handle. from there, we separated data into states, where we ran into our next obstacle. We couldn't find correlating overall insecticide and pesticide usage that reasonably effected the decrease of butterfly populations. From there, we realized we needed to look at each chemical individually.
Accomplishments that we're proud of
We each came into this datathon as beginners; none of us had a grasp on Python when we started. Not only did we learn and code our entire project in Python, but we learned cool new skills like HTML and web-scraping. We've learned so much in these two days. Even beyond python basics and graphical representation software, we've learned how to parse out relevant data from behemoth datasets to retrieve conclusions that we can work with and present specific results on.
What we learned
We have learned the value of planning and analyzing not just the issue, but how our findings should contribute to the key goals of our finished product. Also, Redbull is a fantastic partner of butterflyDatathon.
What's next for butterflyDatathon
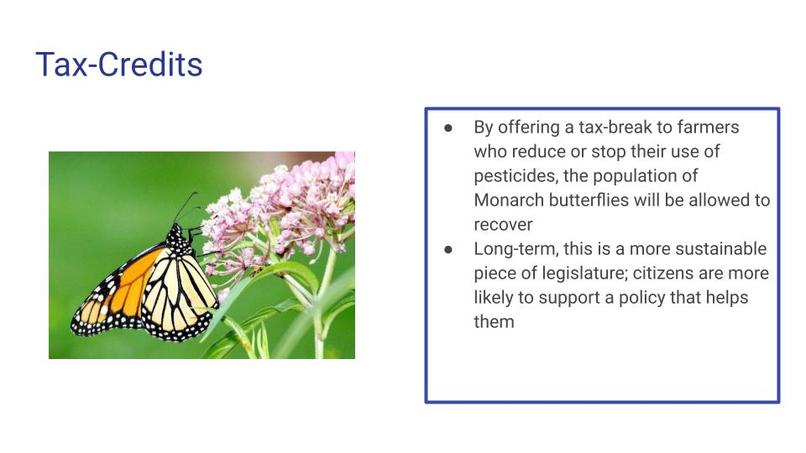
Our next course of action is analyzing what effects these pesticides have on butterfly sanctuaries. From this knowledge, we can learn how to create more sustainable and better protected harbors for our pollinators. From there, we can develop a more robust and productive set of instructions for the creation of future waypoints. Additionally, our current findings can be very helpful in the future creation of a tax credits to help farmers with their transition to safer alternatives.


Log in or sign up for Devpost to join the conversation.