-
-
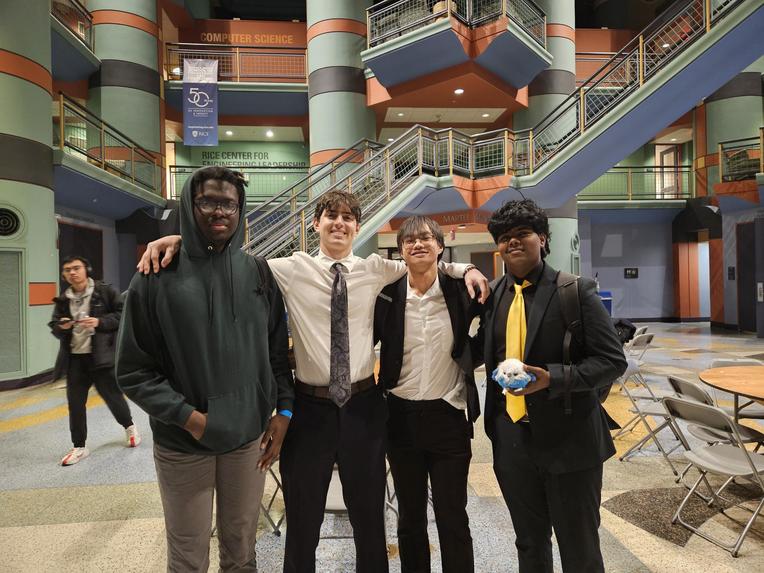
The team excited for day 2 after a quick break to the hotel to shower!
-
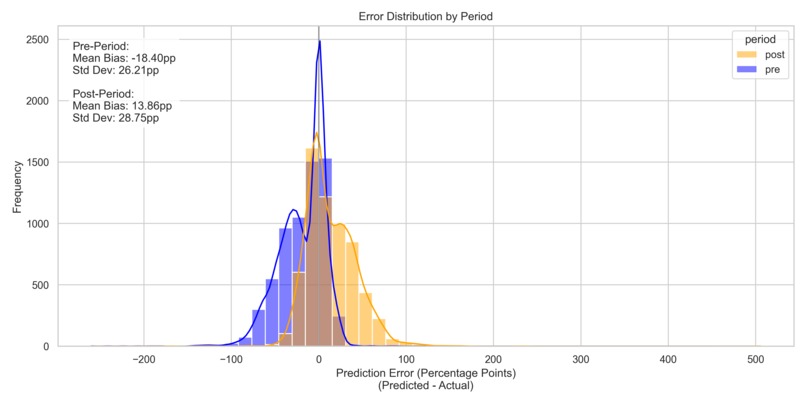
Error based on regime.
-

Putting our hours in!
-
Error distribution.
-
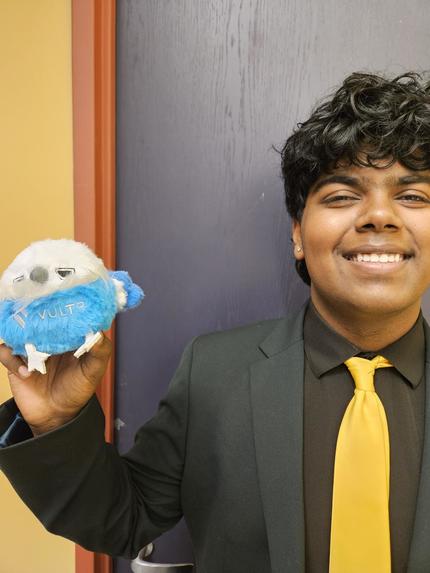
Vultr specialist hard at work!
-
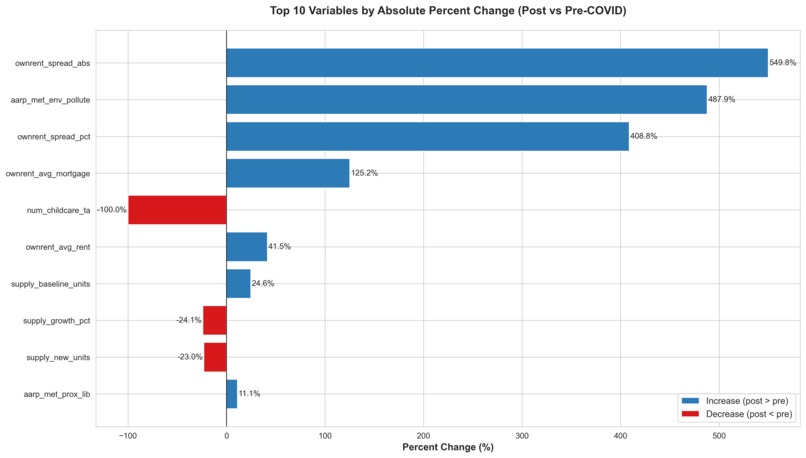
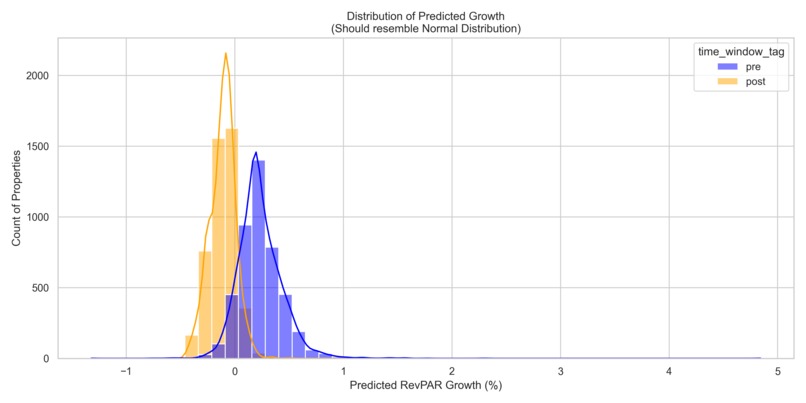
Top drivers pre and post Covid.


RevPAR Growth Prediction – Devpost Story
Our Takeaway
This project tested all our abilities and took our math, and software engineering skills past their limit. We have developed so much in the span of just two days and met so many incredible people. Although we were nervous taking a flight to a competition none of us had any experience in, Rice Datathon 2026 was truly an incredible way to compete in our first ever Datathon representing the University of South Carolina!
From us, a sincere thanks to the Datathon organizers who took time from their busy schedules to make this event possible. We are also so very grateful to the Broadvail mentors who made themselves available and guided us in these exploratory journeys. And as always, thanks to my peers for competing.
Project Motivation
- COVID-era volatility made RevPAR forecasting unreliable, our analysis could generate a pragmatic way to reduce risk in multifamily apartment investments for Broadvail.
- We saw a regime split (pre vs post COVID) in the data - a single model blurred signals, so we set out to prove that separate ensembles would win the battle for the best model.
- Track Goal: Our objective was to minimize the RMSE of RevPAR growth from a set of buildings provided by Broadvail based off of three other datasets sorted by their drivetime (an important indicator, as we would learn).
What We Built
- Two specialized growth models (pre 2015-2020, post 2022-2025) combined via an optimized ensemble. This was the ideal combination based on results from our Bayesian Optimizer.
- 6-model base stack (XGBoost, LightGBM, CatBoost, Ridge, MLP, SVR) with a Ridge meta-learner.
- 114+ engineered features (interactions, polynomials, ratios, RevPAR stats) and robust scaling.
- Production scorer:
pipeline/run_production_pipeline.py→ testing/growth_predictions_optimized.csv + testing/prediction_summary_optimized.txt. - Best test performance: $\text{RMSE}_\text{combined} = 6.64\,\text{pp}$ (pre: 2.15pp, post: 9.14pp) — a ~22% improvement over the unified baseline (8.51pp). Woohoo!
How We Built It
- EDA uncovered two regimes; we split data by
time_window_tagand trained period-specific ensembles. - Feature engineering pipeline (114+ signals): interactions (REVPAR × units), polynomials, ratios (units_per_area, supply_ratio), RevPAR stats, domain indicators.
- 5-fold stacking to train the meta-learner on out-of-fold predictions, avoiding leakage.
- Iterated on advanced features; kept only what improved test RMSE. Removed a 31-feature "advanced" set that hurt pre-period performance.
- Pipeline verifies the input file then outputs the predictions and a summary.
Challenges
- Regime instability: Post-COVID recovery is inherently noisy, even good models hit an entropy wall. Some variance is unavoidable.
- Feature bloat vs signal: Extra recovery-phase feature engineering improved post-period by only +0.07pp but degraded pre-period by 0.69pp. We couldn't be having that, so we scrapped the idea.
- Model inputs alignment: Ensured tree models received named columns and bypassed strict validation where necessary to keep scoring robust.
- Other methods: Methods like Probabilistic Neural Networks (black boxes), Knowledge Graphs (not developed enough), and SVMs weren't sufficient for the robustness we needed.
What We Learned
- Splitting by regime (pre vs post) is the simplest, highest-leverage move for turbulent markets. Not being able to optimize more in post after a point though (hitting our plateau) was still discouraging.
- More features ≠ better: once pre-period is near-perfect (99% R²), additions mostly add noise. Sometimes, enough is enough.
- Stacking shines when base models capture different facets of the data. Ridge meta-learner provided stable weights to do just that.
- Renters interests shifted from being dominated by housing cost to healthier lifestyle post Covid. Although the top predictor of RevPAR is still previous Revenue, holistic elements have replaced other cost-based burdens as the next most important factors.
Results (on the 15% Test set)
- Pre: RMSE = 2.15pp, R² = 0.9878
- Post: RMSE = 9.14pp, R² = 0.5395
- Combined: RMSE = 6.64pp, R² = 0.9040
Track Fit
- Broadvail / Social / Visualization: Clear, interpretable results are demonstrated in our presentation and prediction document. We were able to apply ML techniques supported in research to create insight for Broadvail that has community impact. Our results are interpretable through insight on our presentation (and more in our Github) to enable easy understanding.
- Vultr: Pipeline runs cleanly on cloud VMs that Vultr makes possible. Integration and free credits over this weekend allowed us to try a multitude of models efficiently and settle on our Ensemble approach.
- Underclassmen / Visiting: Leveraged our skillset in unique ways and made substantial strides in our learning in our first ever Datathon (avoided choosing Beginner track).
- Gemini/Eleven: Ensemble + meta-learning approach aligns with model-composition themes. Our custom voice-chat-integrated GPT trained on the Broadvail datasets, insights, and RevPAR predictions was a perfect implementation of these tools and allows anyone to understand the inner workings and inght that our model brings without technical experience or even staff on hand.
Concluding thoughts
We are very happy to have produced an applicable, highly effective prediction set by statistical standards. But we also believe the process is just as important as our end product, and our approach didn't start off nearly as smooth as it may seem.
From our quick, down and dirty linear regression baseline to see where our RMSE started (spoiler: much, much higher than our final result) to our first MultiLayer Perceptron model and XGBoost systems to our Ensemble Finale, we've been through a lot.
There were many lessons along the journey. First, changing tactics can be a game-winner if you're not hesitant. A key strength of our approach was consistently reevaluating how effective our pipeline was. Never be afraid to change your tactics if the data is backing it. The courage to throw ourselves in headfirst to new methodologies, even taking a two hour break from coding just to read Financial Forecasting papers, allowed us to thrive being uncomfortable.
We also saw the value in diversity. Our team wasn't the typical hackathon-molded students. Our lack of experience, as freshman, made us unique for inviting challenge and volunteering to participate as part of our school's Hackathon club. But what mattered was passion. Similarly, the Computer Engineering, Math, and Computer Science background we had may not have been traditional, but it allowed us to tackle problems in ways other competitors may not even have thought of.
It's been amazing, so thanks for the ride Rice!
Next Steps
- Enrich post-period with macro signals (rates, supply indices) to see if we can shave ~0.2–0.3pp without hurting pre-period. Exogenous data would significantly improve our results.
- Add lightweight dashboards to visualize prediction distributions and uncertainty bands for stakeholders. Can build off our existing voice-chat enabled custom GPT.
- Research Knowledge Graph Integration further. Established potential with some baseline tests here (~18% RMSE RevPAR).
Built With
- canva
- catboost
- elevenlabs
- excel
- gemini
- knowledge-graph
- lightgbm
- machine-learning
- mlp
- open-router
- optuna
- python
- pytorch
- ridge-regression
- scikit
- scikit-learn
- scikit-optimize
- seaborn
- shell
- svr
- tensor
- vultr
- xgboost


Log in or sign up for Devpost to join the conversation.