-
-
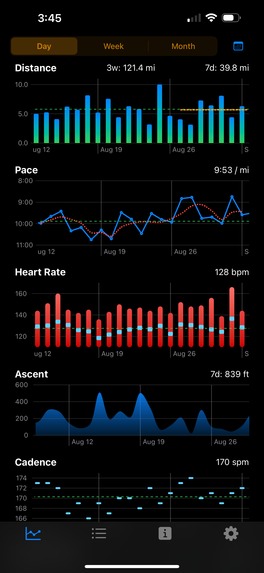
Day charts
-
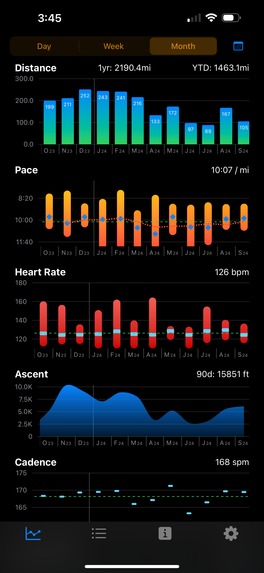
Month Charts
-
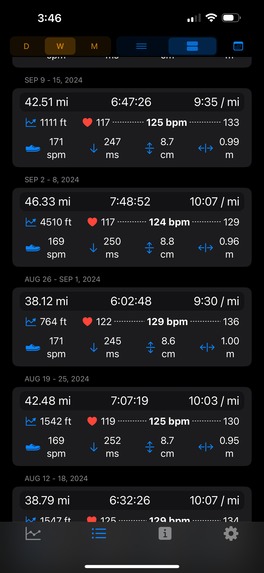
List View
-
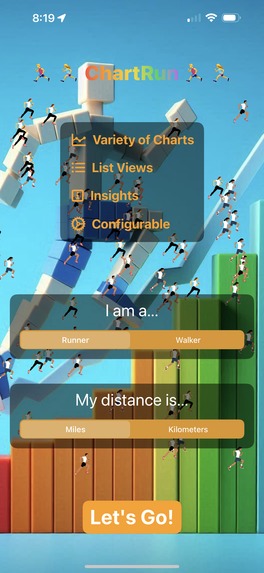
Onboard Setup
-
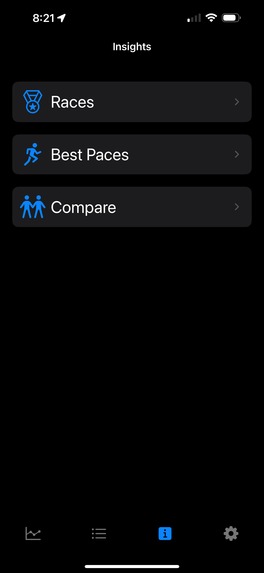
Insights
-
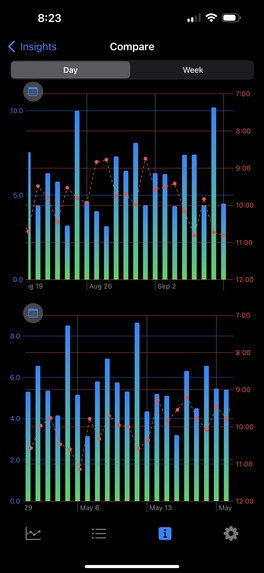
Compare workout periods


Inspiration
There are over 50 million runners in the USA, and I'm one of them. I love running with my Apple Watch and viewing my history in the Fitness App. But that app only shows one workout at a time. It's very hard to track progress over time. So I wrote ChartRun which graphs and lists your workout history with a variety of summaries. Once I had the workout history, I found several ways to extract insights and graph information.
It can get tiresome (pun intended) to train for long periods to improve one's health and fitness or target a goal like a road race. ChartRun can help one stay motivated and progress toward goals.
What it does
ChartRun reads workout data from Health, analyzes and organizes the data, and presents it in a variety of ways. The app currently processes distance, duration, heart rate, ascent, cadence, stride length, vertical oscillation, and ground contact time. The data is aggregated into scrollable day, week, and month graphs, as well as list summaries. Some graphs have period summaries, average or moving average lines. There are date pickers to jump to specific time windows.
An Insights tab (with paid subscription) provides several ways to look at your data, with more planned. You can view best paces over standard distances, and compare workout charts over 2 time periods.
The app provides most features for free, but is limited to 31 days of history. A paid subscription provides years worth of history, adds month graphs and lists, and unlocks the Insights tab.
How we built it
I built the app in Swift with SwiftUI, SwiftUI Charts, HealthKit, and RevenueCat for the paywall and subscription support.
Challenges we ran into
The first hurdle was extracting appropriate data from HealthKit. It's a very diverse data store, and requires careful decomposition to extract desired data in the right format. It took a lot of experimentation to find the right units and data types to get the APIs working.
The second big hurdle was wrangling SwiftUI Charts to graph data the way I wanted. The documentation is somewhat lacking. I spent more than half of my time experimenting and trying various ways to get data to plot properly, scale and label the axes, and scroll charts together.
Parsing and aggregating workout data to produces summaries, averages, ranges, etc. took some deep thought and a bunch of synthetic data to look for edge cases.
Accomplishments that we're proud of
The app works quite well. I've been using it for the past few weeks to track my workouts and find it insightful and fun to use.
What we learned
I learned a lot about HealthKit data, SwiftUI Charts and RevenueCat. It only took about a day to integrate auto-renewing subscriptions into the app using RevenueCat. It probably could have gone faster, but I had to jump around the documentation and examine the SDK to find all the pieces I needed.
What's next for ChartRun
I look forward to bringing ChartRun to market. I have plans for several additional features like tracking Power and Elevation for charts and lists. There are several Insight types I'd like to add like composite graphs, goal tracking, and training assessments.
I plan to reach out to running groups to get specific testers to provide additional feedback, suggestions, and help direct future development.
Built With
- healthkit
- revenuecat
- swift
- swiftui
- swiftuicharts

Log in or sign up for Devpost to join the conversation.