-
Frontpage

Inspiration
We were inspired by Capgemini to tackle a problem that deals with sustainability. We wanted to highlight the effects of CO2 emissions on our planet as it plays a significant role in our ecosystem.
What it does
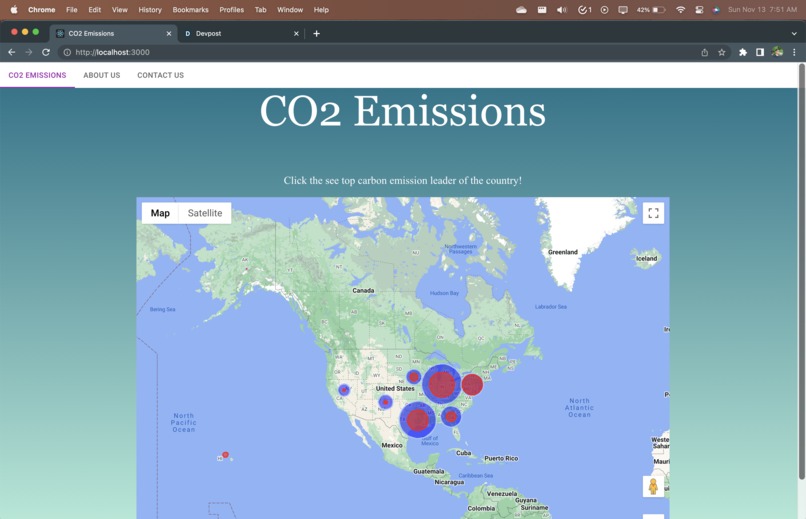
Our project parses through the Greenhouse Gas Reporting Program's (GHGRP) emissions data provided by the United States Environmental Protection Agency. The project utilizes Google-Map-API to plot the locations of the facilities and provide a visualization of their respective CO2 emissions.
How we built it
React framework for the front-end. Python Flask backend Google-Maps-API
Challenges we ran into
GitHub hates us. Google banned us. React bad.
Accomplishments that we're proud of
Initially, we had no direction in what we wanted to tackle, and we were very close to giving up. Our greatest accomplishment would be that we maintained perseverance and determination to complete the project and successfully did so.
What we learned
We can all agree that the Hackathon itself was a great opportunity for us to learn as this was a first for most of us. We got to experience the entire programming process from concept generation to deployment and were all an integral part of this journey.
What's next for CO2 Emissions Visualization
There are a lot of features we plan to add in the near future which includes creating filters so the user can refine the visualization to only include certain attributes, using machine learning for vector quantization (K-means clustering) so that we can partition the CO2 emissions more accurately, and also incorporate predictive modeling to analyze future patterns of CO2 emissions produced by various facilities.


Log in or sign up for Devpost to join the conversation.