-
-

co2counter icon
-

-

co2counter: Determine a transparent carbon strategy for your business.
-
Integrate with your Expense Records, No special surveys and measurement studies.
-
Aim Carbon Neutrality
-

Fresh Carbon Offsetting Opportunities
-
Targets and Progress visible on a Dashboard


Inspiration
Climate change is a heavy concept to take action on, and it doesn't seem very easy to monitor both progress and its effects. When we saw the hackathon concept, monday.com's mission to make work processes more accessible and integrated helped us to understand one of the pain points; carbon policies run by companies require a focus and sometimes need consultancy. There should be an easier way to be aware of the situation and determine some reduction/avoidance strategies for the companies, independent from the scale. Climate action shouldn't be a thing to procrastinate but to raise awareness together.
What it does
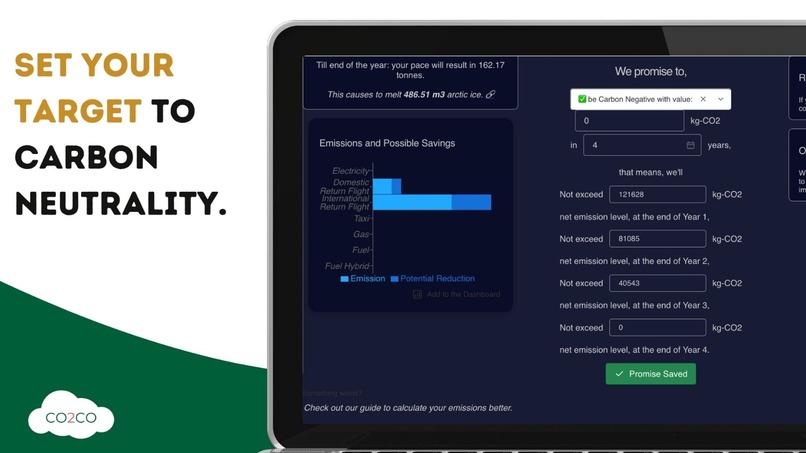
- Set your CO2 emission targets.
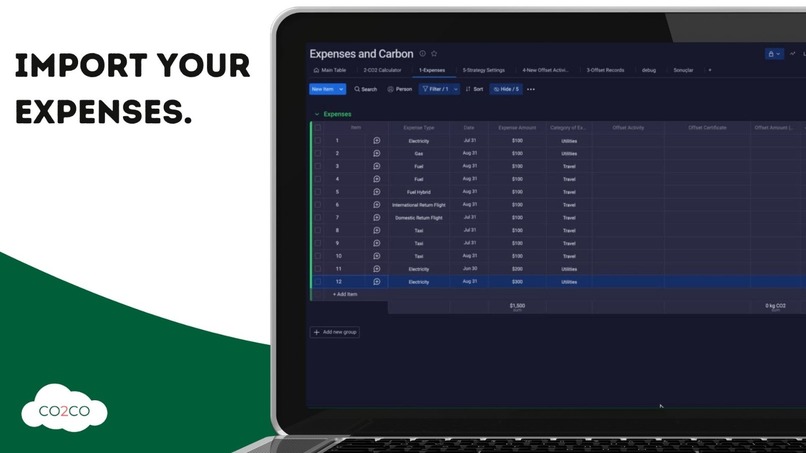
- Import your expenses.
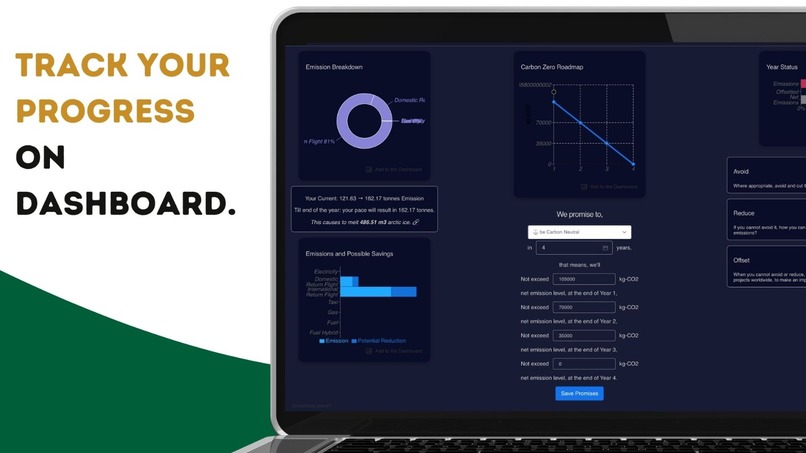
- Track your CO2 footprint on the dashboard.
co2co is a tool to calculate the carbon footprint of your expenses by using monday.com's end-to-end work os capability. It is fully customizable to reflect reality more. Carbon footprint calculation is only one step that most calculators accept this step enough; after footprint, co2co help you to draw a strategy to reduce your net emissions and set targets. It has widgets to monitor the company status available to all colleagues continuously.
How we built it
We developed Co2counter with React JS. We used monday.com tables to store our data. We used various charts for data representation. When starting the development process, we first identified the problems in this area. We decided that it is essential that companies can follow their carbon policies and that it is vital for company employees to be aware of this issue in their daily business activities. We built our solution around that. We decided that using company spending to calculate carbon emissions was the most efficient solution, as currently, company spending is kept in a common area. Then, we completed the benchmark by examining different competing applications in this field. Since unit prices of energy types such as electricity and gas vary in each region, we chose London as the pilot region. Still, these areas can be quickly adapted for different parts on monday.com tables. Then, we determined the carbon emission values by verifying them with different sources. We got the unit prices from the websites of the relevant providers in London. Then we prepared the data structure required on monday.com on the tables and made it actionable. All calculations are done on the tables.
Challenges we ran into
Our first challenge was to make sure that the data in the area of carbon emissions are accurate. For this we had to check different sources.
While developing the solution it was difficult to validate data for the whole world and as a solution we provided a customizable interface. In this way, all institutions can customize their data fields for themselves.
What's next for co2counter - Carbon Strategy
Carbon strategies, policies and targets are moving slowly from volunteering-based SDGs to regulated areas. In terms of upcoming regulations and climate taxation systems, co2co will be a tool to help companies to calculate these kinds of requirements.
In the carbon strategy monitoring market, almost mature products are available. To innovate in this area more, we would like to target end users to make these climate actions and strategies a joint effort.
Carbon tools are far from the end users and are used by a department in typical occurrences. Starting as a Monday.com app provides an excellent opportunity to participate in team routines worldwide.
Built With
- javascript
- monday
- react
- recharts


Log in or sign up for Devpost to join the conversation.