-
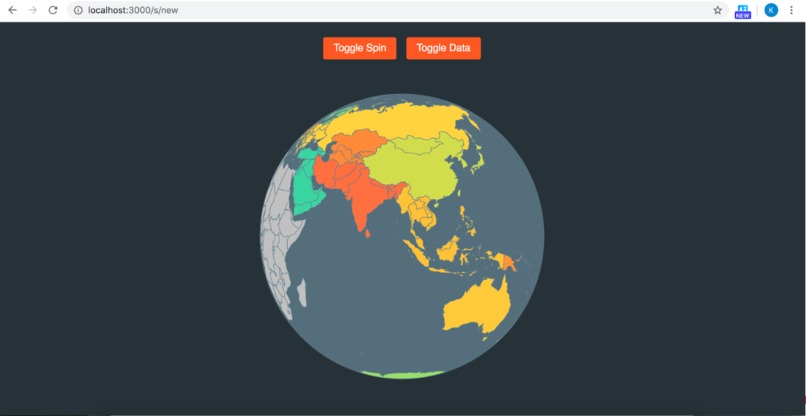
The visualization of the globe which shows on home page
-
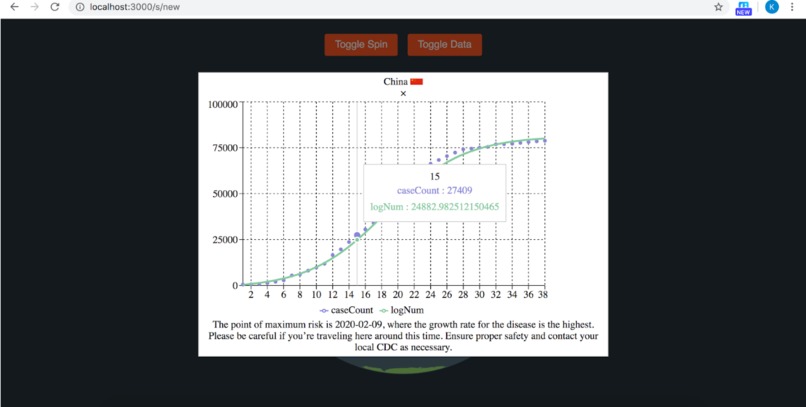
picture of the analytics shown by graph


Inspiration
There has been an impending crisis from the corona virus which has spread from country to country. There are tons of news articles published daily about this virus and the number of cases that have spread globally. We realized it's crucial to provide an efficient and interactive method to understand the virus and it's spread in order to secure oneself, while also tackling the World Health Organization's objectives such as providing help to the people who are impacted.

What it does
Using a globe visualization paired with an ML-based regression algorithm inspired by this IEEE paper and by utilizing real-time data from Johns Hopkins University, we attempt to solve some of the WHO’s COVID-19 objectives.
 A user (traveler, interested citizen) can:
- Observe a map of the coronavirus outbreak as well as the point of maximum risk
- Understand if they should self-quarantine based on their previous traveling
How we built it
By utilizing the latest technologies like react.js and scikit-learn, we are able to create the globe as well as perform live data analysis for each country. Further pairing with a flask-restful API we created a reliable method to send data across the backend and frontend to perform real calculations
Challenges we ran into
Identifying the proper way to map the data was a challenge. One of our team members, a future biology major, provided us with the necessary background information to map the data of epidemics. After finding multiple research papers we found one which maps the data to a logistic-regression function which accurately maps the epidemic based on its sensitivity and resistivity. We also had trouble making the front-end look bright and snazzy, for which we found new react components to alleviate that need.
Accomplishments that we're proud of
Being able to create a relatively clean globe visualization while ensuring access to real-time data for a real-time problem, thus allowing for an accurate analysis of data. Furthermore being able to create a variety of graphs that could help people solve life-threatening cases was an inspiration that we're proud to contribute to.
What we learned
The importance of always at the bigger picture such as the cultural, financial, political, social and psychological impact that an epidemic could have and how we as individuals could contribute our time to help attempt to solve this problem. Furthermore, the importance of using technology for the benefit of others is a beautiful use to be able to simultaneously create meaningful applications while understanding the technological background.
What's next for Corona Calculated
- Send to US State Department so a wider population can access this
- Directly integrate with real-time data API
- Incorporate a mesh network to allow multiple people to provide data to tailor the model
- After getting more data, utilize a more advanced time-series analysis algorithm like an RNN
Built With
- bubble-tea
- pandas
- python
- react.js
- scikit-learn
- super-smash-bros


Log in or sign up for Devpost to join the conversation.