-
Home Page
-
Storytelling about the different cyber attacks
-
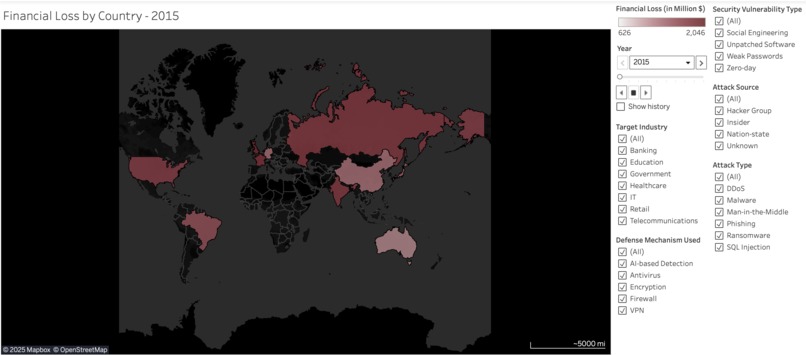
Global cyber losses in 2015 by country. Darker shades show greater impact, with filters for vulnerability, source, industry, and defenses.


Inspiration
We were motivated by the desire to learn how powerful data visualization can be in telling stories, bringing awareness, and uncovering hidden patterns. Cybersecurity affects everyone, yet the raw data can feel overwhelming or inaccessible. By combining storytelling with visuals, we wanted to make complex information easier to understand and more engaging.
What it does
Our project uses narrative visualization to showcase global cyber attack data from 2015–2024. Instead of static charts, we built an interactive story that highlights trends, key events, and the impact of attacks in a way that anyone can explore and connect with.
How we built it
We started with Kaggle’s dataset. The data visualizations were created in Tableau Public, which gave us the flexibility to make interactive graphs. We then embedded these visualizations into a custom website built with React.js, where we layered in storytelling elements and scroll-based interactions inspired by projects like The Pudding.
Challenges we ran into
- Debugging scroll-based storytelling functionality in React.js took much longer than expected.
- We had to downscale the project scope to focus on one type of attack rather than all.
- Embedding and styling Tableau visualizations inside our site required trial-and-error to get the responsiveness and performance right.
Accomplishments that we're proud of
- We stuck together as a team and kept pushing even when bugs and setbacks slowed us down.
- We successfully built a working prototype that blends Tableau + React storytelling.
- We learned how to pivot our scope while still keeping the vision of our project intact.
What we learned
- The power of Tableau for building interactive data stories quickly.
- How to combine data visualization and frontend frameworks to create a narrative web experience.
- The importance of scoping and prioritizing features in a hackathon setting.
What's next for CyberImpacts
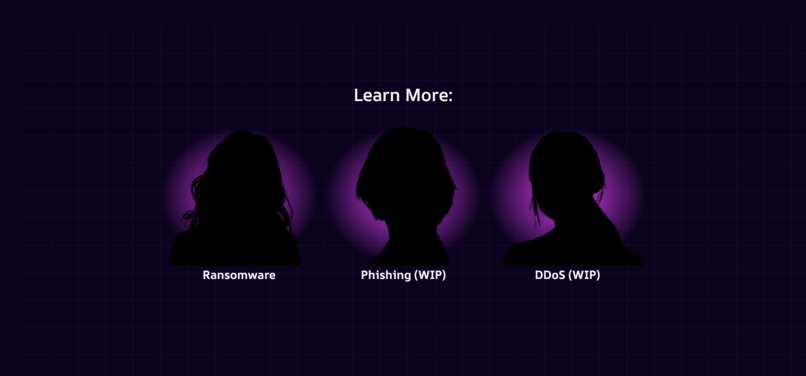
Right now, our story focuses on ransomware attacks. In the future, we want to expand it to cover other attack types like DDoS, man-in-the-middle, and phishing. Each of these has unique stories to tell, and we believe expanding the project will make it an even more powerful tool for understanding the global cybersecurity landscape.


Log in or sign up for Devpost to join the conversation.