-
-
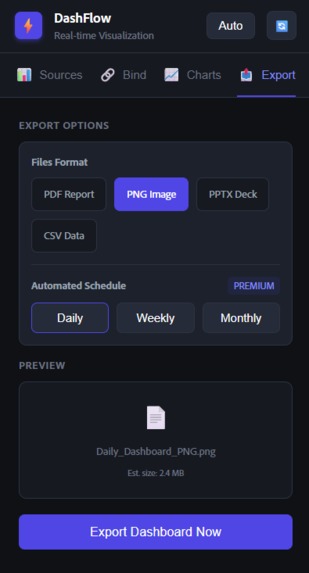
export page
-
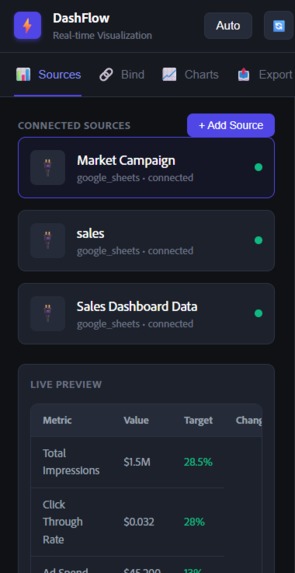
main sources- google sheets
-
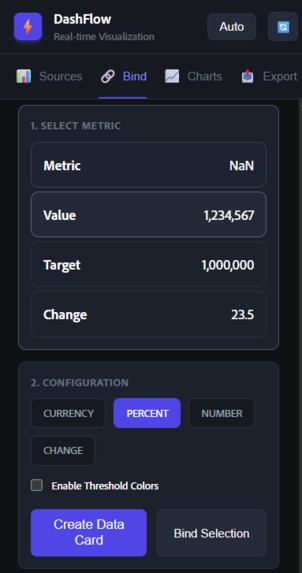
binding page


Inspiration
The initial spark for DashFlow came from a common frustration in the modern workplace: the disconnect between design and data. Designers create beautiful dashboards in tools like Adobe Express, but they are static "snapshots" in time. Meanwhile, data analysts live in spreadsheets that are functional but visually uninspiring. We asked ourselves: "What if your design tool could listen to your database?" We wanted to bridge this gap—turning Adobe Express into a live surface where a "Revenue" text box isn't just pixels, but a window into a live SQL query or Google Sheet.
What it does
DashFlow transforms static Adobe Express designs into living, breathing dashboards that automatically update with real-time business data. Core Capabilities
- Connect to Your Business Data
Integrates with Google Sheets, Salesforce, HubSpot, and custom REST APIs Secure OAuth authentication for all data sources Preview data before connecting to ensure accuracy Support for multiple simultaneous data connections
- Bind Document Elements to Live Data
Select any text element and map it to a data field (revenue, conversion rate, customer count) Bind shape colors to performance thresholds (green when above target, red when below) Connect charts to data arrays that automatically update Show/hide elements conditionally based on data values No coding required—everything is visual drag-and-drop
- Automatic Refresh Scheduling
Set dashboards to refresh every 15 minutes, hourly, daily, or weekly Different refresh rates for different data sources Smart scheduling that respects API rate limits Manual refresh option for on-demand updates Displays "last updated" timestamp for transparency
- Intelligent Data Formatting
Currency formatting ($1,234.56, €1.234,56, £1,234.56) Percentage displays (45.2%) Number abbreviations (1.2M, 345K, 12B) Date formatting with relative time ("2 days ago") Custom formulas for calculations (revenue - costs = profit) Month-over-month and year-over-year growth calculations
- Visual Performance Indicators
Traffic light system: green (above target), yellow (at risk), red (below target) Dynamic icons that change based on data (✅ when goals met, ⚠️ when at risk) Automatic color changes for shapes and text Threshold rules that trigger visual changes Multiple condition support for complex business logic
- Auto-Generated Charts
Creates bar charts, line graphs, pie charts, area charts from your data Charts automatically update when data refreshes Customizable to match your brand colors and fonts Responsive sizing that adapts to your design Supports multiple data series for complex visualizations
- Multi-Page Dashboard Support
Create comprehensive reports with multiple artboards Each page can connect to different data sources Independent refresh schedules per page Navigation between dashboard pages Perfect for executive summaries, detailed breakdowns, and appendices
- Automated Export & Distribution
Automatically exports updated dashboards as PDF, PNG, or PowerPoint Scheduled distribution via email to stakeholder lists Posts to Slack channels when dashboards update Uploads to Google Drive or SharePoint folders Password-protected public links for external sharing
- Historical Snapshots & Comparison
Automatically saves dashboard versions after each refresh Compare current data vs. previous periods (day, week, month, quarter) Visual diff highlighting with up/down arrows and percentage changes Timeline view showing data trends over time Export historical comparisons for presentations
- Proactive Alerts & Notifications
Get notified when metrics cross critical thresholds Email, Slack, and SMS alerts for urgent situations Custom alert rules based on your business logic Success notifications when goals are achieved Digest summaries of dashboard changes
How we built it
DashFlow is built as a dual-layer application leveraging the Adobe Express Add-on SDK:
The UI Layer (React + TypeScript)
- Handles user interaction, data fetching, and state management.
- We used
fetchadapters to pull data from our Node.js backend (simulating live connectors to Google Sheets/CRMs).
The Sandbox Layer (Document API)
- This is where the magic happens. We used the
sandboxProxypattern to securely send commands from the React UI to the canvas. - We implemented a robust
DocumentSandboxApiinterface to handle complex operations like "Create Bar Chart" or "Bind to Selection".
- This is where the magic happens. We used the
Challenges we ran into
- The "Off-Screen" Ghost elements Early in development, we struggled with elements spawning outside the user's viewport.
- The Problem: Our
getSmartPosition()logic was relative to the last selected item. If a user selected an item at the far right edge ($x > 800$), new charts would spawn at $x > 1200$, disappearing into the void. The Solution: We implemented a "Safe Anchor" system. Now, critical elements like the KPI Grid force a hard reset to $x=50$ if no safe relative position is found, ensuring visibility every time.
The Data-Design Bridge Connecting a specific text node to a specific data ID was tricky.
The Problem: The Add-on SDK manages nodes by internal IDs that can change across sessions.
The Solution: We utilized the node's
nameproperty as a persistent tag (binding-{id}). This allowed ourupdateBoundElementfunction to scan the scene graph efficiently.- Responsive "KPI" Grids Our initial KPI row was a single horizontal strip. With 4+ metrics, it became too wide for standard document setups.
Evolution: We pivoted from a 1x4 Row to a 2x2 Grid Layout. This reduced the bounding box width by 50%, making it the perfect mobile-friendly component for social media posts.
Accomplishments that we're proud of
What we learned
- Safety First: Always handle edge cases . A crash in the sandbox layer can freeze the entire add-on experience.
- User Feedback is Vital: Adding "Toast" notifications (little popups saying "Link Created!") significantly improved the feeling of responsiveness.
- Separation of Concerns: Keeping the heavy data processing in the React layer and sending only "render instructions" to the Sandbox kept the UI snappy and the canvas rendering smooth.
What's next for DashFlow
Immediate Roadmap (Next 3 Months)
- AI-Powered Insights Auto-generate natural language commentary on data trends. Instead of just showing "Revenue: $127K", display "Revenue up 23% vs last month—strongest growth in 6 months, driven by enterprise segment." Implementation: GPT-4 analyzes data changes, identifies patterns, and generates contextual insights. Users can accept, edit, or regenerate suggestions.
- Natural Language Queries Let users say "Show me sales by region for Q4" and DashFlow automatically creates the appropriate chart with correct data bindings. Removes technical barrier to dashboard creation. Vision: Conversational interface where you describe what you want to see, and the dashboard builds itself.
- Template Marketplace Community-contributed dashboard templates for common use cases (sales pipeline, marketing funnel, financial overview, product metrics, HR dashboard). Accelerates adoption and shares best practices. Business Model: Free basic templates, premium templates from professional designers, revenue share with creators.
- Mobile Companion App View live dashboards on phone, receive push notifications when metrics change, approve urgent decisions on-the-go. Brings executive visibility to mobile-first leaders. Key Feature: Thumb-friendly navigation optimized for quick checks between meetings.
- Advanced Collaboration Real-time co-editing with presence indicators, commenting on specific elements, version branching and merging, role-based permissions (viewer, editor, admin). Goal: Make DashFlow the "Figma of business dashboards" with multiplayer capabilities.
Built With
- add-on
- adobe
- css
- express.js
- node.js
- react
- sdk
- sqlite
- typescript

Log in or sign up for Devpost to join the conversation.