-
The Depth Clock

Inspiration
Accounting has a reputation as a dry industry. Personal financial literacy just isn't people's most developed tool. Consequently, there are thousands who put themselves at financial risk because of a fundamental lack of understanding of important contractual obligations. If we think of the ideal Sole Prop LLC, this can translate to disastrous results when we realise that individuals not only assume the responsibility of their own finances but also the health of their companies as well. Their capacity to navigate difficult money management schedules can mean the difference between burning through cash that should be earmarked for CoGS or operations during vulnerable periods and the execution of a successful business.
What it does
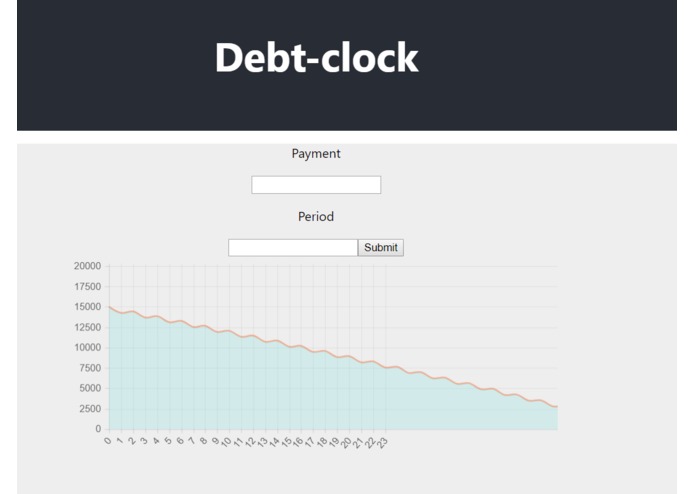
We realised that 'amortisation' is not a common word in most people's lexicons. However, loans are, as we are students in higher learning. We wanted to create a dynamic visualiser to represent loan structures as a function of the number of payments you apply towards your loan to demonstrate how paying off a loan more quickly leads to paying less overall. Through a simple interface, the user can specify these amounts in particular periods in the schedule to see the debt drop quicker.
How I built it
Beginning with an SQL database to represent an accounting suite (from which we pull values), we process the data in a node.js backend to create array representations of the progression of a loan as it is paid off. We then fed these arrays into a visual graph displaying it with React.js.
Challenges I ran into
- Making sense of the accounting data and clean it for our use case
- Learning how to build a website in React.js from scratch
- Connecting a node.js backend with the react.js frontend, while developing it in different teams
Accomplishments that I'm proud of
- A working product
- Being able to implement our initial idea
- Delegating the workload in the team
What I learned
- react.js + node.js
- That accounting is hard!
What's next for Debt Clock
- Quickbooks integration, import the data from their API
- More data visualisation
- Track stats over time
[Capital One Fintech Challenge]

Log in or sign up for Devpost to join the conversation.