-
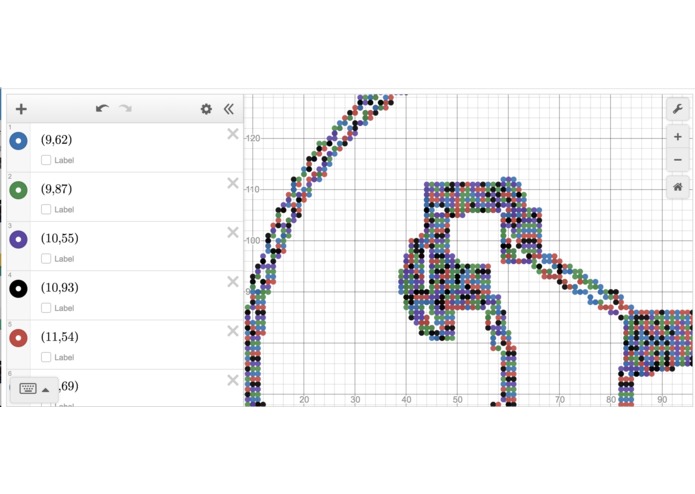
plotted goat image
-
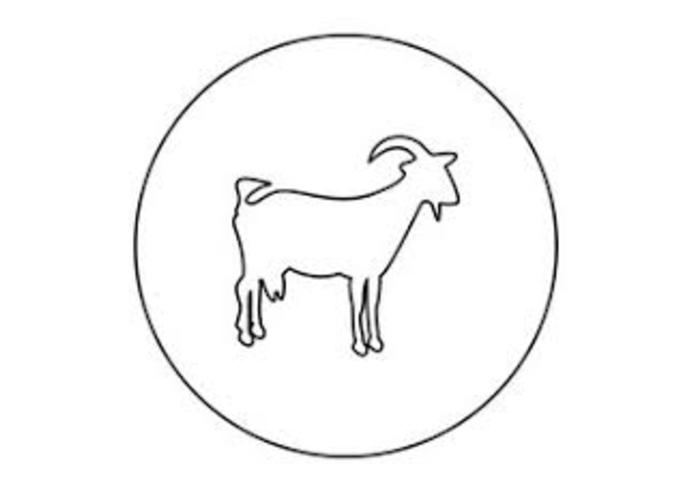
original goat image
-
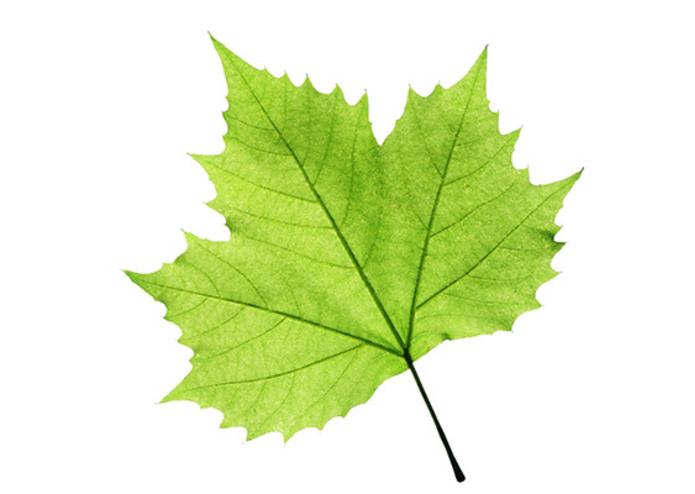
original leaf image
-
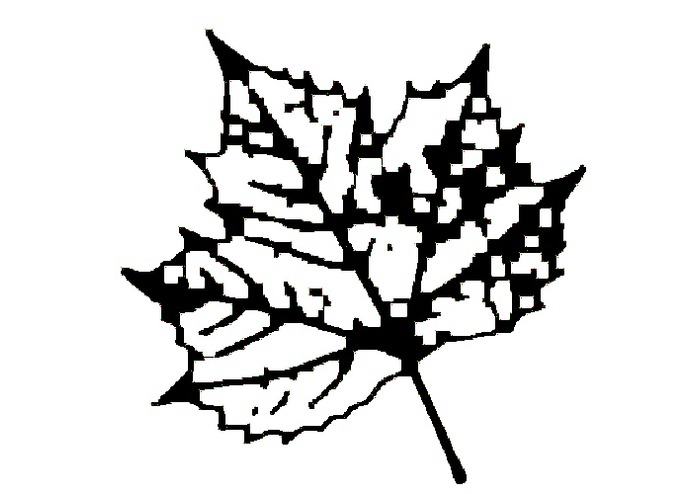
eroded and diluted image
-
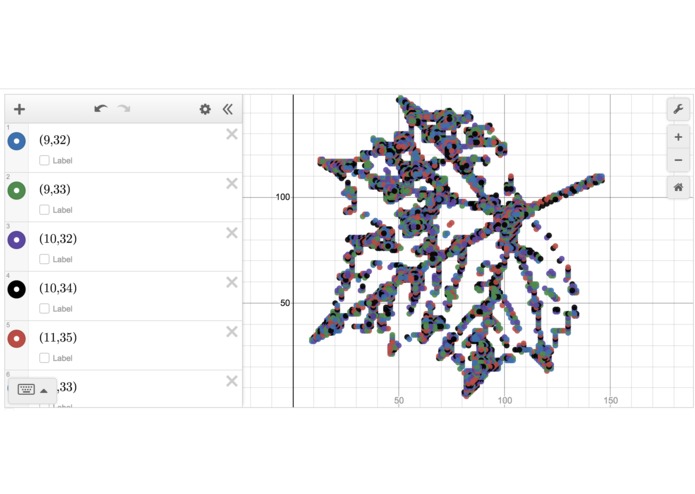
plotted leaf image
-
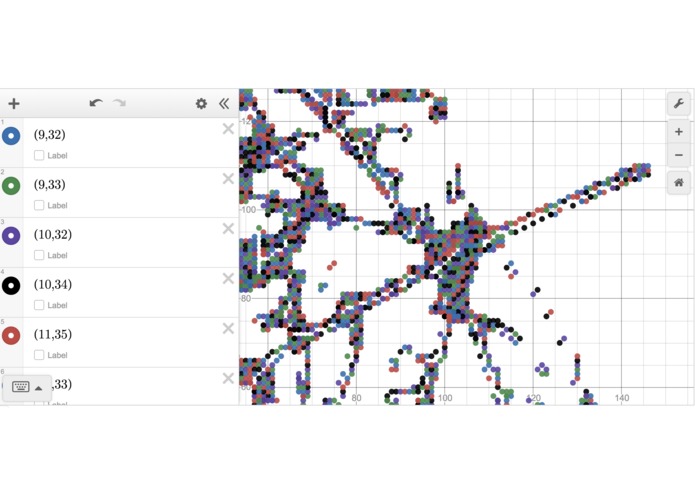
closer view on leaf image points


Inspiration
People frequently like to spend time plotting their graphs and making shapes on Desmos.
What it does
It takes any image and turns it into a series of points that are then plotted onto the webpage containing a Desmos shell.
How we built it
We took an image in and first dilate and erode the edges to connect any possible leaks in the outline that is retrieved using CV's Canny. Following that, we converted to grayscale and applied Zhang-Suen's Algorithm for Thinning images and sent the relative points as seen on a matplotlib plot through a Flask server which processed through the web application.
Challenges we ran into
Figuring out the Zhang-Suen Algorithm for Thinning was confusing, as well as figuring out a way to process the images in a reasonable time.
Accomplishments that we're proud of
Figuring out the Zhang-Suen Algorithm was confusing.
What we learned
Long runtimes are really annoying.
What's next for Desmos Art
Improving runtime, connecting line segments to form curves split at the corners using Harris Corner Detection.

Log in or sign up for Devpost to join the conversation.