-
-
Digital Urimeter
-
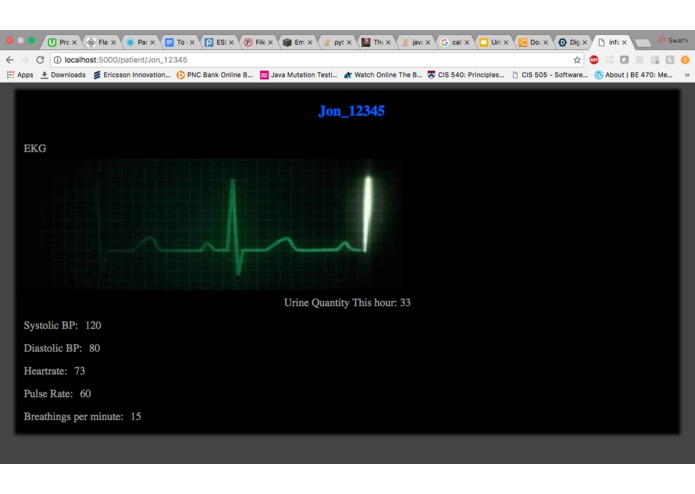
UI
-
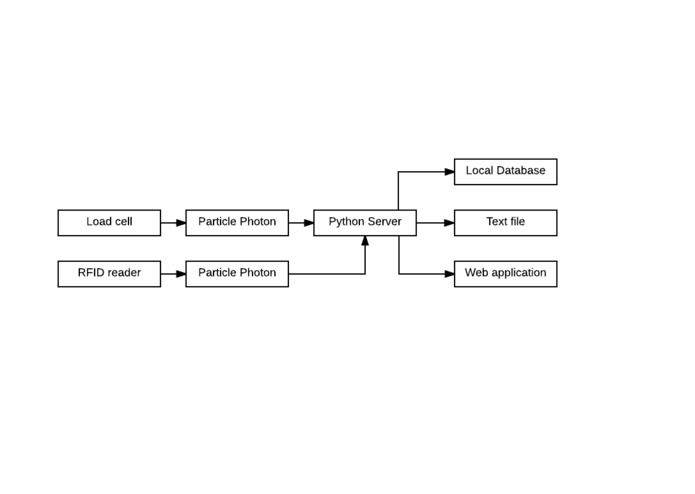
System architecture
-
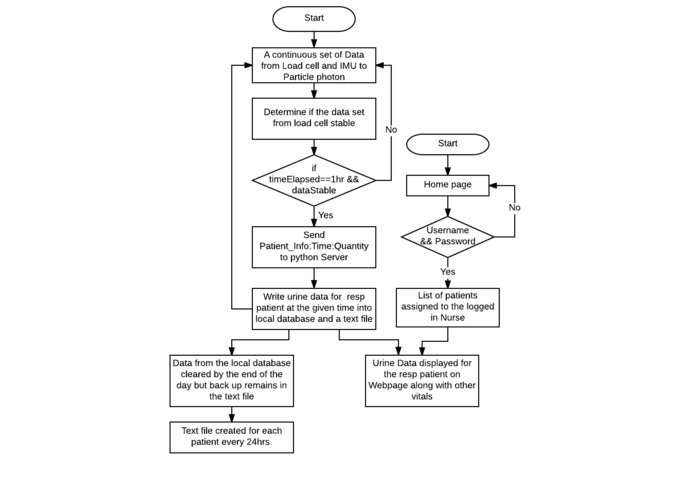
Flow chart
-
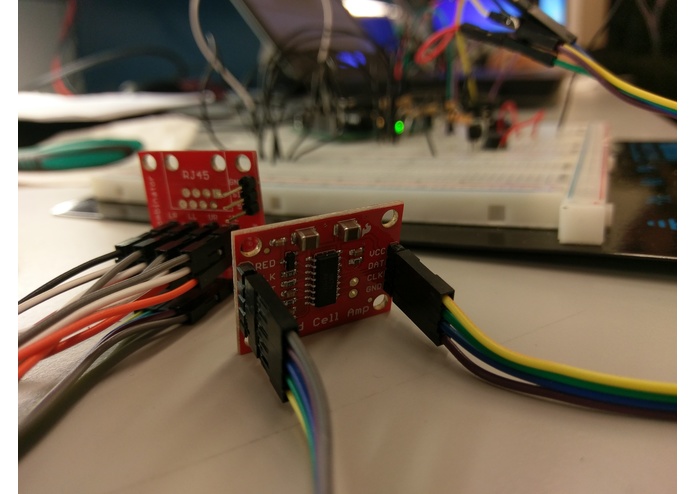
Load Cell amplifier
-
Calibration
-
Calibration values
-
Temperature Effect on Output Status 3 - Matlab
-
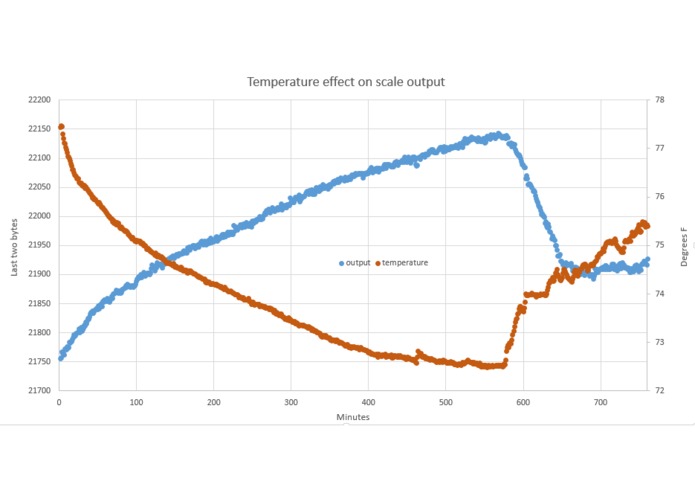
Temperature effect on scale output
-
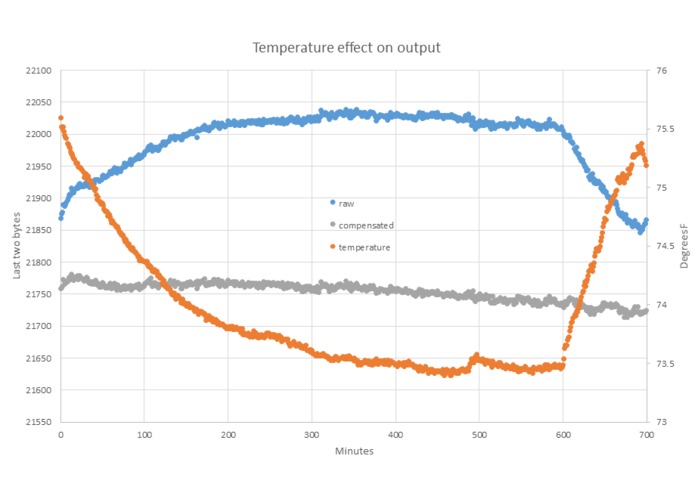
Temperature effect on output
-
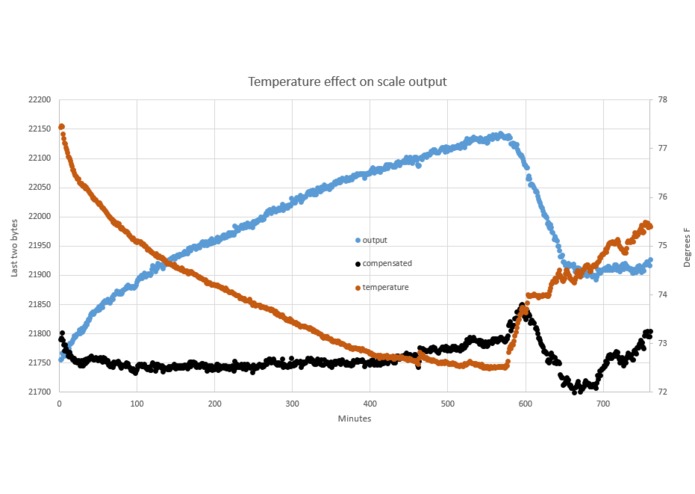
Temperature effect on with Compensation scale output
-
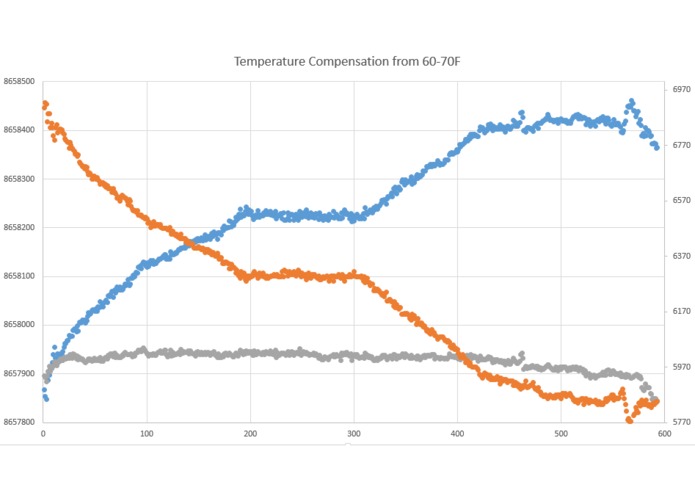
Wider range of temperature - effect on load cell output
-
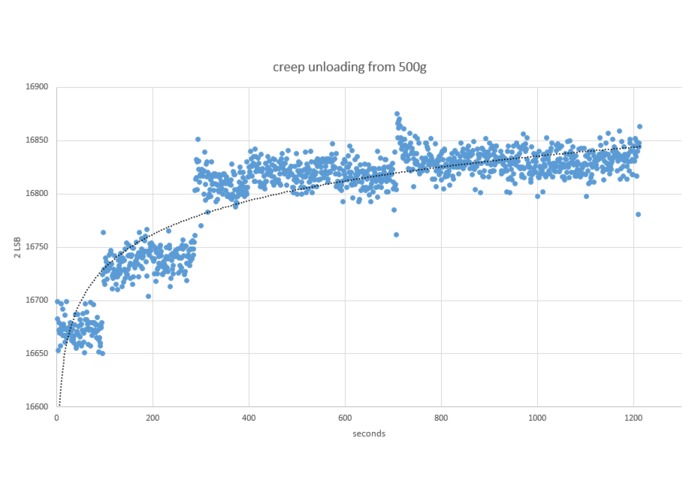
Creep plot
-
Data Capture on Server


Github
https://github.com/nswathi/DigitalUrimeter/tree/master#digitalurimeter
Inspiration
The problem definition states that, currently nurses are manually noting down the quantity of urine along with other information on an hourly basis. This is a true process orchestration issue. Data is being manually and repeatedly re-entered in a generation where technology is so advanced to avoid this. The team identified the real need of a solution and being passionate on process orchestration decided to adopt this as the final project. The team is looking forward to approach the issue from a different angle, i.e., by weight.
Goal
The device automates the nurse’s task of keeping track of urine quantity. With our solution, quantity of the urine is automatically updated onto a database on an hourly basis without the nurse having to physically be present at the bedside for checking. The only manual task involved now is the necessity to replace the urine container every 24hrs.
Status
Status 1:
The system measures quantity of Urine using the Load cell circuit initially built for a Kitchen scale. These have three wires, which connect to three nodes in a series of two strain gauges, depicted as resistors in the figure below. As the load increases, the resistance of one resistor increases while the other decreases. Four of these sensors were arranged in a Wheatstone Bridge in order to increase resolution. In the Picture: Wheatstone, A- and A+ are fed into a HX711 24 bit ADC and their difference (multiplied by 64 gain) is outputted through serial communication.
After some testing, we found that these load cells were not ideal for a few reasons: The wire used to connect the four individual load sensors into a Wheatstone bridge introduces a bit of resistance into the circuit (especially since the wire was long and thin, around 30 gauge) The wire was also stranded, and a slight touch to exposed wire would make a few strands snap off. This makes it even harder solder a good connection to the board. Because of this, any slight movement to the wire greatly affects the output. In the end, we decided to go with a common 4-wire load cell. Picture Loadcell
Status 2:
The common 4-wire load cell comes in a Wheatstone bridge format and is overall a better instrument. When determining whether the load cell is practical for this application, we see whether it is consistent, precise, and accurate. After testing out the load cell with a set of weights, we found it to have a precision of +/- 1 g. This is sufficient since our target resolution for the urimeter is +/- 2 mL. However, its consistency wasn’t quite up to our standards. We found that when a constant (or zero) load on the scale platform is left for a while, its weight reading started accurate, but drifted away as time passes by.
Looking into the inconsistencies of the load cell, we found that there are a few types of drift involved.
Creep:
The change that occurs after unloading or loading a load cell. Proportional to the weight amount. Occurs during a time frame of about 30 minutes and stabilizes. Can be corrected through a compensation equation. In Picture: Creep plot, we track the output of the device after a 500g load has been left on for a while. For the sake of resolution, the two lowest bytes were used. For comparison, 1 g is approximately 180 units of change. As can be seen, the output goes from around 16675 to 16825 in the span of 20 minutes, which is about 0.8g of creep.
Offset drift:
The output may drift away from its current value. The conversion factor remains constant, but the ‘zero’ of the scale changes (this is one reason why scales have a tare feature). This can caused by changes in temperature. As the metal in the load cells goes through thermal expansion, the strain gauges attached to the load cells is also affected.
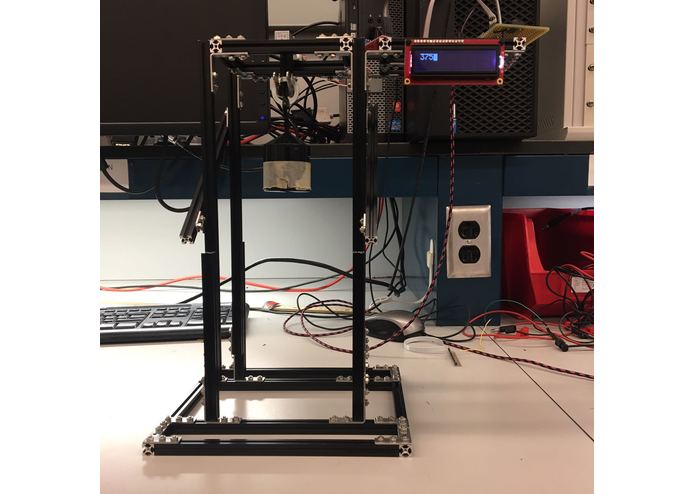
Setup
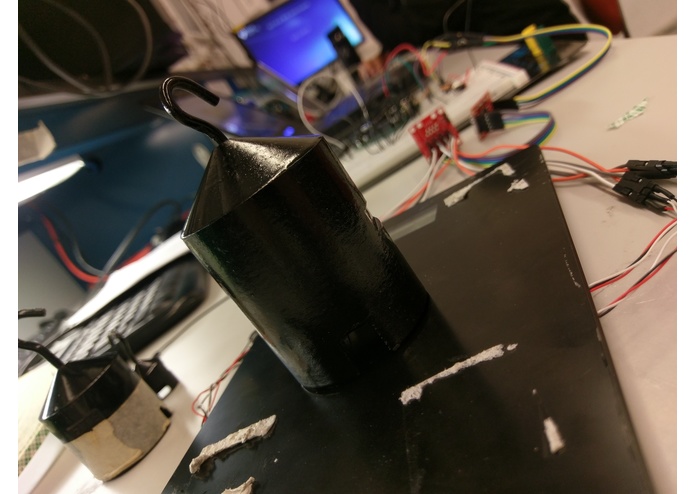
Materials: Atmega328p Sparkfun Load cell amplifier- Hx711 24 bit ADC Uxcell Load cell 0-5 kg Testing bench LM34 temperature sensor
First, we built a testing bench for the load cell, a three piece setup (plus nuts and bolts). See Picture: Setup For temperature data, we used the LM34. See Picture: LM34 We used the atmega328p as our microcontroller. The output of the LM34 was hooked up to the analog input PC0 and the data/CLK pins from the load cell amplifier was hooked up to PB2/PB1. We sampled at 1 Hz and output the average value through the serial monitor once per minute. Below is the data collected overnight. This was done with 1 kg load on the scale. We can see that temperature and the scale output is related. For comparison, every gram is about 220 units. See Picture: Comparison
Although the two types of drift involved make the load cell inconsistent, they are at least deterministic. This means we can compensate for these in software and get within our target accuracy at all times.
Equation: Compensation = Output + ( 7/9 )( Temperature - 77 )
Using a simple linear transformation using the raw output and temperature, we can get rid of most of the temperature drift. See Picture: Temperature Effect on Scale Output We went from about 400 units of drift to about 150 units a drift, a 60% decrease. Weight wise, the range went from 1.8 g to 0.7 g. To show that this isn’t just some equation that only works for this set of data, we ran another trial overnight and applied the same equation. See Picture: Temperature Effect on Output In this case, our drift range went from 175 units to about 50 units, a 70% decrease. Weight wise, our range went from 0.8 g to 0.2 g. Drift due to temperature is the main cause of inconsistencies in load cells. Now that we’ve shown that we can achieve our target +/- 2 mL accuracy through changes of temperature, load cells can be a good choice for this application.
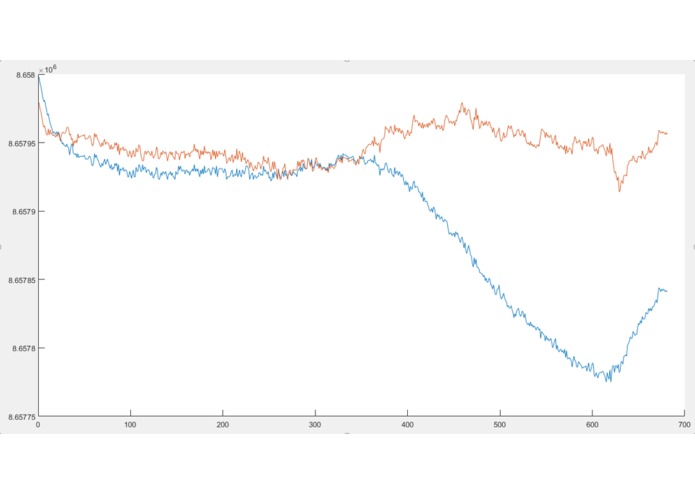
Status 3:
Before, we looked at the data and made up a quick linear conversion to reduce the temperature effect on the output. Now we try to make the conversion a little better. See Picture: Temperature Effect on Output Status 3 - Matlab This time, we have the full hex values since we plan to implement this one in code. We start with our original linear transformation ocomp=on+a(tn-tref) Where on and tn are the nth scale output and temperature output, respectively. The value tref is what we want our compensation to be biased around. Ideally, the output of the compensation will be a flat line at oref, the corresponding scale output to tref. Since we are trying to minimize the drift, we use the following optimization problem: Minimize max **((oref-on-a(tn-tref))^2) ** The values of oref and tref are chosen arbitrarily, the compensation will be biased around oref. In code, we will probably define oref and tref at the moment the scale is zeroed.
The optimization was done using CVX for MATLAB
The optimized compensation equation found was: comp=o+0.5177(t-tref) The value tref is left as a variable because we found that the optimized coefficient wasn’t heavily impacted from changing tref/oref. This tells us that the temperature effect on the output does not depend on the current output.
In the Picture: Temperature Effect on Output Status 3 - Matlab, blue is our raw output and orange is out compensated output. The drift range for the raw output is 223 units, roughly 1 gram. The drift range for the compensated output is 65 units, about 0.3 grams.
Status 4:
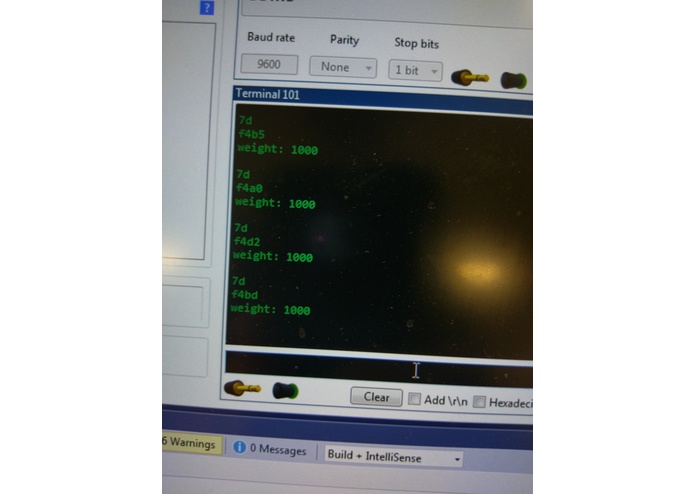
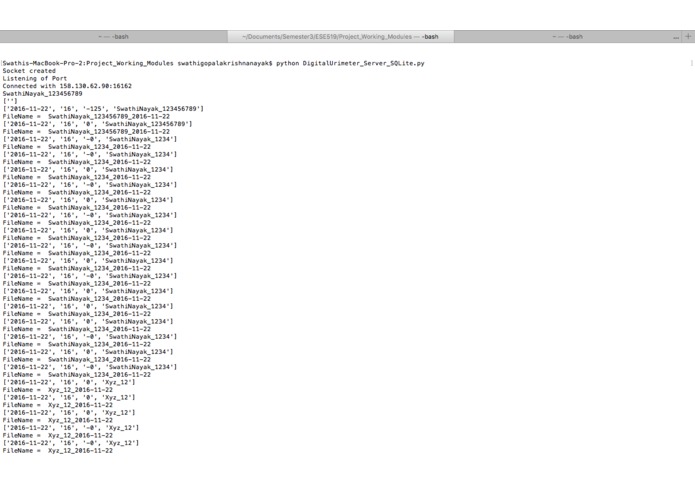
The data collected from the Urimeter is stored into both local and cloud database. The Urimeter sends the data to a Python written server code which then updates the databases as per the patient information provided. For the local database we are using SQLite. The server establishes connection with the client and proceeds with data collection only after the first basic handshake where the client sends the Patient Info:IP to the server.
Urine quantity data is sent to the server on an hourly basis, along time at which data was sent. This is ensure that even when the Wifi connection is lost the data is stored in the flash memory of the photon. Whenever the connection is back, this data is sent to the server which then updates the local database.
The database refreshes the data every 24hrs. We are maintaining a PatientInfo_Date.txt file for each day which not only logs the data but also keeps track of date, time, connection established/lost etc.
Hospital Visit
Current process
- A main monitor at the ICU waiting lounge which has summary of vitals of all patients in ICU - EKG, Heart rate, Blood pressure, number of times breathing per minute
- A monitor at each ICU with patient's vital information
- Nurse manually checks the urine measurement from the bag which hangs in the bottom of the bed and goes to her nurse desk to enter the value he/she viewed. Drawbacks: Highly prone to human errors, sometimes nurses miss checking measurement due to busy shift.
- Currently everything needs to be manually checked and approved by the nurse before saves are made(Overriding option) to the medical record. Else it maintains local saves.
- Often the beds are moved around
- Nurses do not have any form of alarm when the urine value is in the critical region.
Nurse suggestions
- Beep/ led flashing when data is being sent from device.
- Alarm: Color coded mark to note value in danger zone.
- Battery backup as the bed and device needs to be moved around
- Flashing of LED when disconnected from wifi
- Worried about weight slack
Status 5: Baseline Goals
- Calibrate load cell to achieve high accuracy(About 1g): Temperature compensation technique with overnight testing in different temperature conditions,
- Physical data acquisition, regression testing with mock patient setup,
- Display of basic patient information on the setup using small LCD display,
- Export data into a local database and backup .txt file
- 3D CAD models of proposed design,
- Dynamic patient info change(HTML+photon)
Status 6:
Drift compensation for wider range of temperatures: Overnight testing done to capture drift due to temperature variation- this time for a wider range of temperature. With the above mentioned temperature compensation technique we were able to achieve the same level of accuracy.
Server: The application is launched using python+flask. The python server is multithreaded and manages the 3 types of clients - Urimeter client, RFID based login module and web application. The Urimeter client is of client_ID:1 and on connection, sends data in the form - "Date:Time:UrineQuantity:PatientInfo". This data is then broken down, analyzed and required data is saved into the local databases according to the date, time and patient. RFID based login module is of client_ID:2, on connection sends tagID received from the receiver of the reader. This on match with the user data in the database redirects the web application from "login page" to "logged in homepage".
Status 7: Reach Goal
- Drift compensation for wider range of temperatures,
- Web application that mocks the patient monitoring system,
- Mock patient to Urimeter setup,
- 3D printed model of enclosure for the electronics,
- Ensure data is sent only when the system is stable,
- RFID based login system for nurses,
- Responsive system: Visual feedback on connectivity to WIFI,
- Battery backup
Challenges we ran into
- The measurements drifted even though we had a constant weight on the platform. We used a small padding between the platform and the load cell circuit to significantly reduce the drift - Edit Fixed by temperature compensation technique,
- Made the resolution even better using CVX for Matlab
Accomplishments that we're proud of
- This approach to the solution has been tried and tested in the past but was discarded as it gave to a lot of drift, leading to inaccuracies in the data. The team took up the challenge and was able to achieve a very high accuracy, of about 1g,
- The entire solution built is closed loop. Data is collected from the sensor in a fixed time basis, data stored and retrieved on a web application. From manually data entry to no data entry.
What we learned
Executing SQL queries on python and working with Particle photon builds character :)


Log in or sign up for Devpost to join the conversation.