-
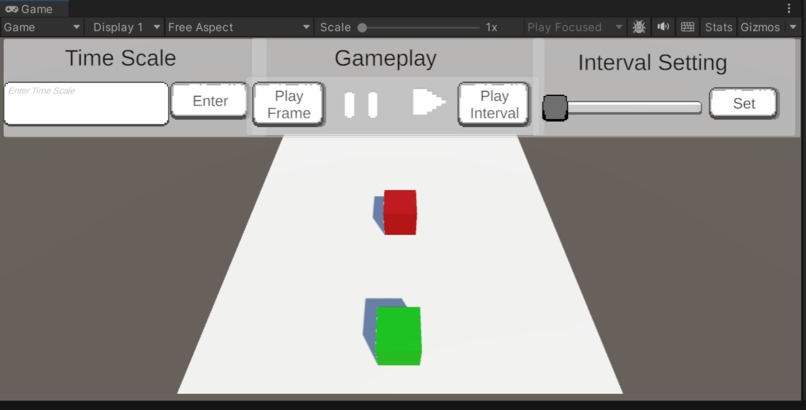
Debugger UI in Unity
-
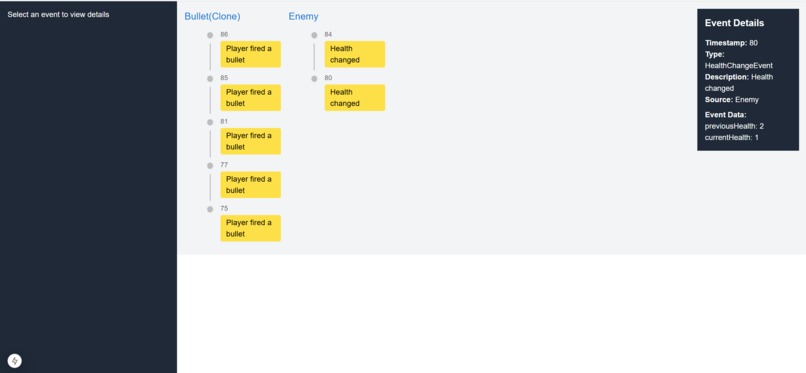
Frontend Display of Game Events By Timeline and Source
-
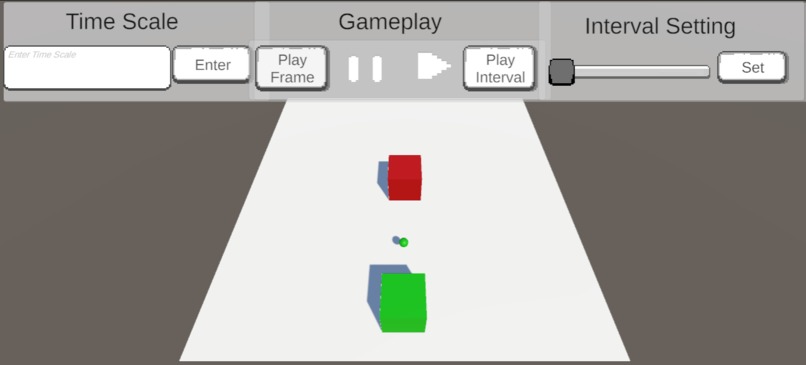
Debugger with Game Paused
-
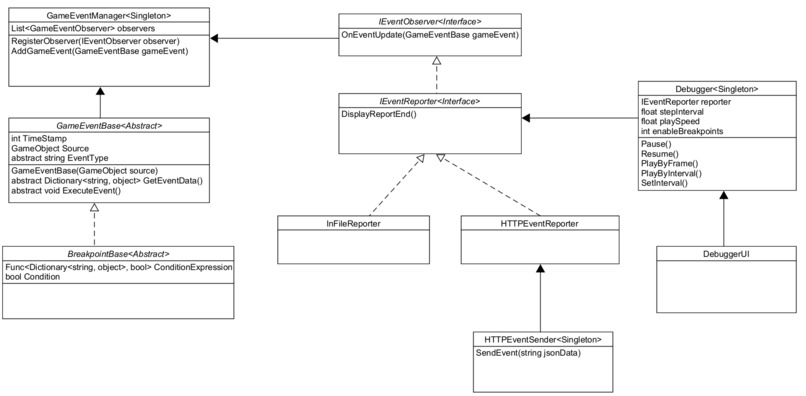
UML Diagram for Unity Backend


Inspiration
Drawing from hands-on Unity development experience, our team has recognized the following limitations of Unity's built-in logging and debugging tool:
1. Limitations of Existing Debugging Tools
Lack of Built-In Debugger: Unity lacks a comprehensive built-in debugging tool that allows for intuitive debugging within the game context. While IDEs like Visual Studio or JetBrains Rider provide robust debugging capabilities, they focus primarily on code-level breakpoints. This makes it difficult to isolate issues stemming from in-game events and interactions, such as player actions or game state changes, which are crucial for gameplay debugging.
Inadequate Handling of Game Events: Traditional debuggers do not account for complex gameplay dynamics where issues often arise from specific player actions or interactions. This limitation makes it challenging for developers to diagnose and fix bugs that do not correspond neatly to lines of code, resulting in time-consuming trial-and-error processes.
2. Unorganized Logging Information
Sequential Log Presentation: Unity’s built-in logging system presents log information in a linear, chronological order. This format can be overwhelming and difficult to navigate, especially when sifting through numerous logs generated during playtesting. Important events may be buried under a long list of unrelated log messages, making it hard to identify and address specific issues effectively.
Lack of Contextualization: Logs typically do not provide sufficient context about the state of the game at the time an error occurred. This can lead to confusion, as developers may struggle to connect log messages to the actual gameplay scenarios that triggered them.
3. Challenges in Error Reproduction
- Difficulty Reproducing Bugs: Bugs encountered during playtesting can often be elusive and difficult to reproduce consistently. Without a comprehensive logging mechanism that captures and visualizes game state in time, developers may find themselves unable to recreate the conditions necessary to diagnose the problem effectively.
- Inconsistent Playtester Feedback: Playtesters may not always be able to articulate or consistently demonstrate the exact steps that trigger an error. Without a robust logging system that captures and visualizes interactions among game objects over time, reproducing the specific conditions that led to the error can be challenging. This lack of precise, real-time data often leads to trial-and-error debugging, slowing down the development process.
What it does
1. Unity Debugger Control
- Description This feature provides manual control over the game execution, allowing developers to pause the game, play the game frame-by-frame or by a small time interval, and set game play speed. This gives precision control over game flow, similar to how a debugger works in coding IDEs. The developer can stop the game at any moment and step through it at their own pace, inspecting how game objects, variables, and behaviors change over time.
- Implementation A user-friendly control panel is integrated directly into the Unity Editor, providing buttons to pause, advance by one frame, adjust speed, or play for brief durations before pausing. These controls enable developers to slow down or dissect specific moments, making it easier to isolate bugs that may be tied to rapid gameplay changes or complex interactions.
2. Event-Based Debugging
- Description Developers can define specific in-game events (e.g., collisions, health reaching zero, player actions) that either log information or trigger a breakpoint. The tool will monitor the game for these events, pausing the game or logging the information when the conditions are met. These event definitions give developers fine-grained control over what the debugger listens to.
- Implementation Developers can create custom events and breakpoints by subclassing
GameEventBaseandBreakpointBase, assigning unique event names, descriptions, and a data dictionary for detailed tracking. These events are logged or trigger pauses when conditions are met, providing developers with essential context without requiring continuous manual intervention.
3. Conditional Breakpoints
- Description Developers can specify conditions under which a breakpoint is triggered, similar to conditional breakpoints in traditional debuggers. For example, the game could pause when an enemy’s health drops below a certain value, or when a player completes a specific input sequence. This prevents unnecessary pauses and focuses debugging on situations that truly need inspection.
- Implementation Developers can set conditional breakpoints by passing a
Func<Dictionary<string, object>, bool>toBreakpointBase, allowing detailed control over when breakpoints are triggered based on the specified conditions. This feature simplifies monitoring by automatically pausing during predefined situations, making debugging more efficient and focused.
4. YAML to Custom Event Parser
- Description This feature simplifies the creation of custom events and breakpoints by allowing developers to define them in a YAML file. The YAML configuration is parsed to generate corresponding C# classes, eliminating the need for manual coding of repetitive structures and ensuring consistency across event definitions. This approach allows developers to manage and update custom events and breakpoints easily through a centralized YAML file, improving maintainability and reducing setup time.
- Implementation Integrated as a Unity plugin under the Tools panel, the YAML-to-C# parser utility reads the YAML file and converts each event and breakpoint definition into a C# class. Each generated class includes fields and methods specified in the YAML, such as custom event names, descriptions, and associated data dictionaries. This automated generation provides a quick, flexible way to update events and breakpoints without altering the codebase directly, streamlining development and debugging. The parser allows for dynamic adjustments to custom events, making it especially useful in iterative playtesting and bug-fixing cycles.
5. Event Log Display panel
- Description The Event Display Interface provides a centralized and interactive dashboard for viewing, filtering, and analyzing game events in real time. Organized in a timeline format, it enables developers to trace the sequence and context of interactions, including timestamps, sources, event types, and detailed custom data. This visual overview helps developers quickly identify patterns, troubleshoot issues, and reproduce specific game states by examining how events unfold across game objects and over time.
- Implementation Events are displayed on a timeline, with each game object represented by its own horizontal track, categorizing events by source. Clicking on an event marker expands its details in a side panel, where developers can view descriptions, data dictionaries, and other relevant information.
Example Use Cases
Scenario: In a game, players report an issue where the character sometimes falls through the ground after jumping.
Solution: Set an event-based breakpoint to trigger when a collision occurs between the player and the ground. The game will pause when the collision is detected, allowing the developer to inspect the exact conditions under which the collision happens, such as the player's velocity, collider properties, or physics settings. By stepping frame-by-frame, the developer can precisely observe what goes wrong during the collision.
Scenario: A bug occurs after a player performs a series of actions (e.g., picking up an item, using it, and then attacking an enemy), but it's difficult to reproduce.
Solution: Use event-driven logging to monitor specific player actions. The debugger can log every interaction the player has with objects, capturing the sequence of events that lead to the bug. These logs, displayed on the event panel, can then be replayed, allowing the developer to trace the issue back to the point where the sequence starts to go wrong.
Scenario: A UI button does not work under certain circumstances, but the code appears correct.
Solution: Set a conditional breakpoint on the button’s OnClick event, but only trigger it when certain game states (e.g., player health is less than 50) are true. The game will pause right when the button click occurs in this specific situation, allowing the developer to inspect all the variables, components, and UI settings associated with that button at the moment of failure.
Scenario: The AI character in the game is expected to chase the player when within a certain range but is behaving erratically.
Solution: Create a conditional breakpoint that triggers when the AI character switches to "chasing" mode, but only if the player is within the wrong range or other conditions are met. By stepping through the game once this condition is triggered, the developer can inspect why the AI character enters the wrong state, check its decision-making logic, and adjust variables.
How we built it
Our development began with implementing the core components: custom events, breakpoints, and an interactive debugger within Unity. Unity handles the parsing from in-game objects to JSON format directly, sending data to the REST API with every new event update, ensuring real-time event capture.
On the front end, built using Next.js, a polling mechanism checks for updates from the backend every second. This approach allows us to display events on an interactive timeline, showing their relationship to affected objects and making it easy for developers to track issues and gameplay interactions as they happen.
We also integrated a YAML parser, which simplifies creating custom events and breakpoints. This feature lets developers define events in a YAML file, which the parser then converts into C# classes. The parser is accessible as a Unity plugin under the Tools panel, making it convenient for developers to manage and customize events with minimal manual coding.
Challenges we ran into
Despite initial expectations, formatting the frontend proved more difficult than anticipated, as many components struggled to align correctly. Additionally, handling events with identical timestamps introduced complications, as new events would override one another rather than displaying sequentially.
Accomplishments that we're proud of
We’re particularly proud of the backend architecture. Our backend design is scalable and adaptable, with a robust architecture that will allow easy expansion and integration of new features. The YAML to C# class parse also streamlines user experience to a great extent. Additionally, despite limited front-end experience among some team members, we embraced the challenge and successfully implemented a user-friendly interface.
What we learned
This project provided us with a unique experience working with Unity UI and effectively managing a project under solid software design principles. For some of our team members, it was also their first hackathon, providing an opportunity to dive into a collaborative and competitive environment of development.
What's next for UnityThunder
We plan to implement a snapshot feature in future extension of the project. The snapshot feature allows developers to capture the full state of the game scene, including all object positions, variables, and game states, at a given point. These snapshots can then be reloaded to allow the developer to start the game from that exact state, simplifying the process of reproducing bugs or testing game changes.
We’d also like to enhance the interactivity of the frontend, allowing users to group and sort events in various different ways to allow users to tailor their UI to their debugging preferences, or to help them see problems from a different angle.
Built With
- c#
- javascript
- nextjs
- react
- rest
- typescript
- unity
- yaml


Log in or sign up for Devpost to join the conversation.