-
-
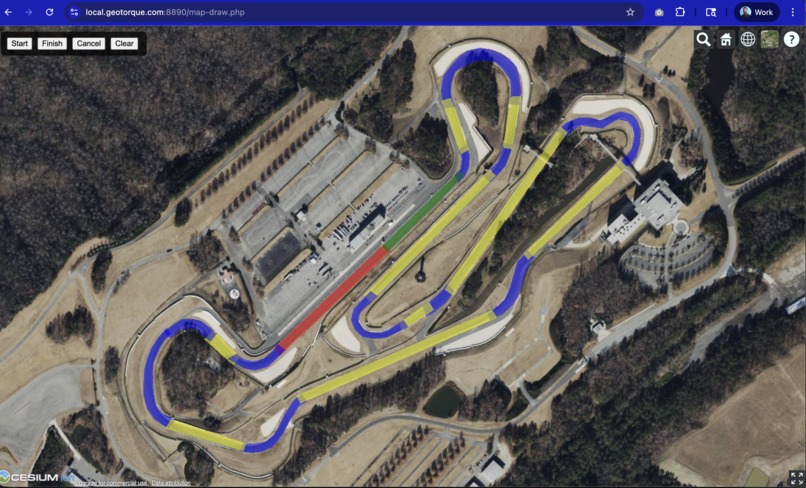
Draw Track Zones using Spatial Polygons
-
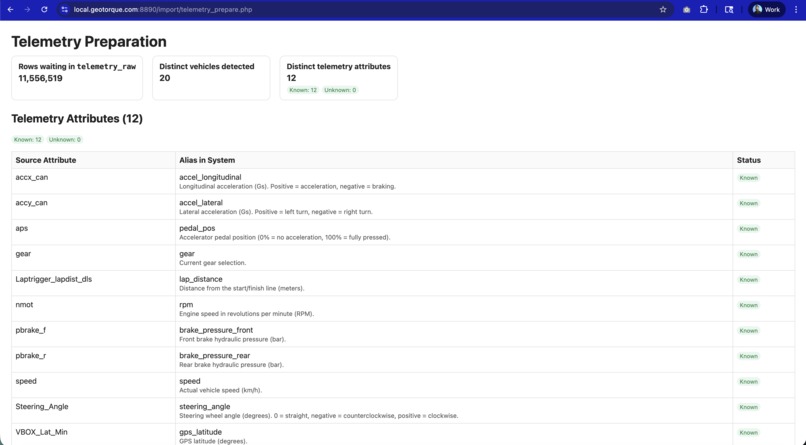
Import Data from a flat file or CSV
-
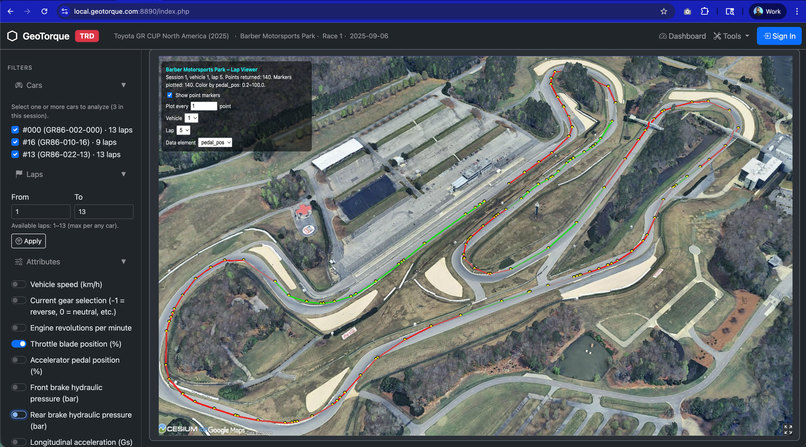
Visualize Laps and Telemetry Data in 3D
-
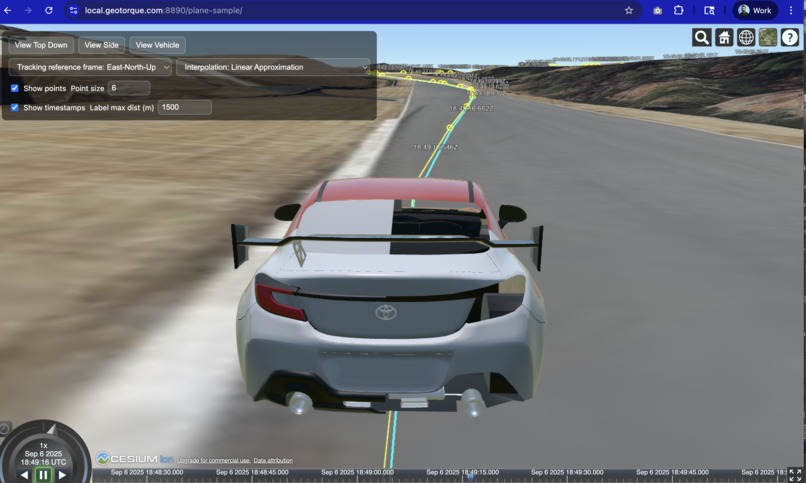
Ride Along to analyze data with a POV with data


About the Project – GeoTorque
GeoTorque started with a pretty simple frustration: trying to get faster on track while constantly getting lost in the data.
I (and our team) spent some time go-karting, and every debrief felt the same. The coach would say things like:
“You’re braking too late into Turn 5,”
“You can stay flat until halfway down the back straight,”
“You’re not using all the track on exit coming out of Turn 9.”
But as a driver, actually remembering which corner was “Turn 5” or “Turn 9” was surprisingly hard—especially at a new circuit.
From a top-down track map, the corners all started to blur together, and it was tough to match those abstract lines to what we actually saw and felt in the kart: cracks in the pavement, a tree line, a marshal’s stand, a bridge, a specific curb. The traditional 2D traces and graphs felt powerful for engineers… but not very natural for the way the driver’s brain remembers a lap.
GeoTorque is our attempt to close that gap by putting telemetry back into the driver’s world: the real 3D track, in context, over time.
What We Built
We focused our hackathon time on three core pieces that work together:
Data Import Tool
We built a pipeline that ingests flat CSV telemetry files and loads them into a MySQL 8 database.- Each sample is tagged with car, session, and lap.
- This lets us query slices of data quickly (e.g., “Car 1, Lap 3, full lap” or “all laps through Turn 7”).
- Each sample is tagged with car, session, and lap.
Track Map Overlay Designer
To make the data meaningful on the track, we created a tool that lets us draw and name segments of the circuit:- Corners, straights, braking zones, special sections, etc.
- Each segment is stored as a polygon in the database.
- When telemetry is imported, every data point can be associated with one or more segments. That means we can easily compare performance in “Turn 3” across different laps, drivers, or setups.
- Corners, straights, braking zones, special sections, etc.
4D Track Data Visualizer
On top of that, we built a web-based visualizer that:- Uses Google Earth 3D tiles to render the real-world track environment.
- Plots the racing line in 3D and animates the car moving around the lap over time.
- Colors or annotates the racing line with telemetry channels (speed, throttle, brake, RPM, etc.).
- Uses Google Earth 3D tiles to render the real-world track environment.
So instead of staring at flat charts and trying to imagine where they occurred, you can literally “fly” around the track, pause at a certain point, and see exactly what the car was doing there.
How We Built It (Tech + Approach)
Stack & Architecture
- Backend: PHP + MySQL 8 for parsing, cleaning, and storing telemetry data.
- Data Model: Tables for cars, sessions, laps, and telemetry samples, designed for fast lookups by car and lap.
- Spatial Logic: Track segments are saved as polygons, letting us map GPS points to sections like “T1”, “Back Straight”, etc.
- Frontend: A web client that uses a 3D mapping/tiles engine to display the track, racing line, and telemetry overlays.
Workflow
- Upload CSV telemetry file.
- Import script parses timestamps, GPS, and channels (speed, RPM, pedal position, etc.) into MySQL.
- Track designer tool is used once per circuit to draw and save corners/segments.
- Visualizer queries the database for a given car + lap and renders:
- The full racing line in 3D.
- Time-based animation along the path.
- Telemetry data mapped into color or UI overlays.
- The full racing line in 3D.
What Inspired Us
The core inspiration came from being in that “driver who’s trying really hard but still confused” situation.
Memorizing turn numbers from a flat map felt unnatural. On track, the mental model is built around:
- Visual references (trees, cracks, marshal stands, bridges).
- Elevation changes and crests.
- How the car feels at a specific spot.
We wanted a tool that lets you review laps the way your brain actually remembers them: as a journey through 3D space, not just a series of squiggles on a graph.
By putting telemetry onto a realistic 3D representation of the circuit and letting you move through it in time, GeoTorque aims to make “data debriefs” feel more like reliving the lap—and less like decoding a spreadsheet.
What We Learned
Over the course of the hackathon, we learned a lot in a short time:
Data modeling matters
Getting the schema right (cars, laps, segments, telemetry rows) made everything else much easier. Once the data was structured well, adding features to the visualizer felt straightforward.Spatial context is powerful
Seeing the same telemetry on a flat graph vs. seeing it wrapped onto a 3D track are totally different experiences. The 3D context immediately makes certain patterns “click” in a way charts alone don’t.UX for technical tools is key
It’s not enough for the data to be accurate; the interface needs to match how drivers, coaches, and engineers actually think. Even small details like naming track segments cleanly or making lap selection quick have a big impact on usability.
Challenges We Faced
Like every hackathon project, time was our biggest opponent.
- We had ambitious ideas for more advanced visualizations:
- Multi-lap comparisons on the same 3D line.
- Ghost car replays.
- More sophisticated color mappings and overlays (e.g., showing delta time directly on the racing line).
- We also wanted deeper analytics by segment (e.g., automatically highlighting where a driver lost most time, or where inputs differ from their best lap).
We simply ran out of time to implement everything we imagined.
Under the hood, balancing 3D rendering, smooth animation, and flexible data querying within a short timeframe was a real challenge. We spent a good chunk of time just making sure the pipeline—CSV → database → track segments → visualizer—was reliable enough to show off.
What’s Next
Even though the hackathon deadline forced us to stop, we don’t really feel “done” with GeoTorque.
We’d love to keep building:
- More 4D visualizations and overlays.
- Better tools for comparing drivers and setups.
- A smoother, more polished UX for coaches and track-day drivers.
GeoTorque started as a way to make our own driver debriefs more intuitive, but we think this style of 3D/4D visualization could be useful anywhere motorsport data is used—driver training, sim-to-real workflows, and even fan-facing storytelling.
For now, we’re excited we were able to turn that original go-kart frustration into a working prototype that brings telemetry to life in 3D.


Log in or sign up for Devpost to join the conversation.