-
-
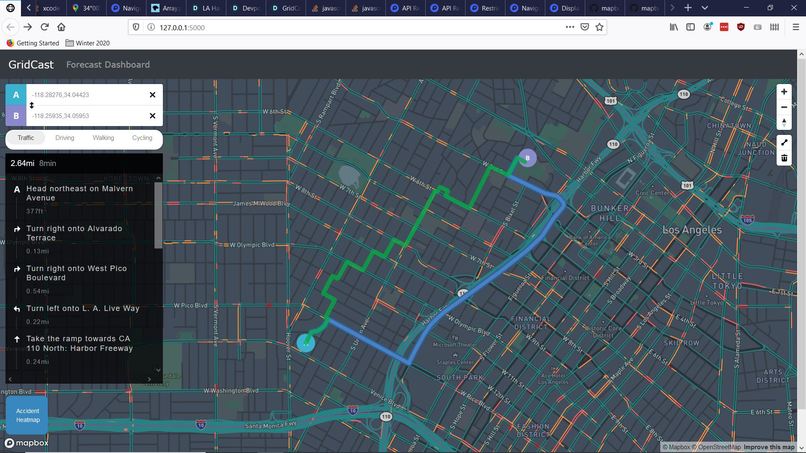
Our safe path up against the fastest path. What will you decide?

Inspiration
In Los Angeles, known for its traffic and crazy drivers with over 50,000 cars accidents a year, a safe path would be an great!
What it does
Visualize dangerous areas for driving in Los Angeles. Use AI to plot a safe route. Forecast the safest times of the day and week to drive.
How we built it
- MapBox
- Dash
- Prophet
- Flask
- Boostrap
- jQuery
- Pandas
Challenges we ran into
- Building a navigation algorithm that avoids danger zones, in particular finding a good heuristic and translating it to MapBox
- Hosting our
fbprophetmachine learning model on gcloud was a challenge given thatpystancould not bee installed. - Integrating Flask and Dash
Accomplishments that we're proud of
- Successfully building the navigation algorithm
What we learned
- Using the MapBox API
- serving machine learning algorithms we trained ourselves


Log in or sign up for Devpost to join the conversation.