-
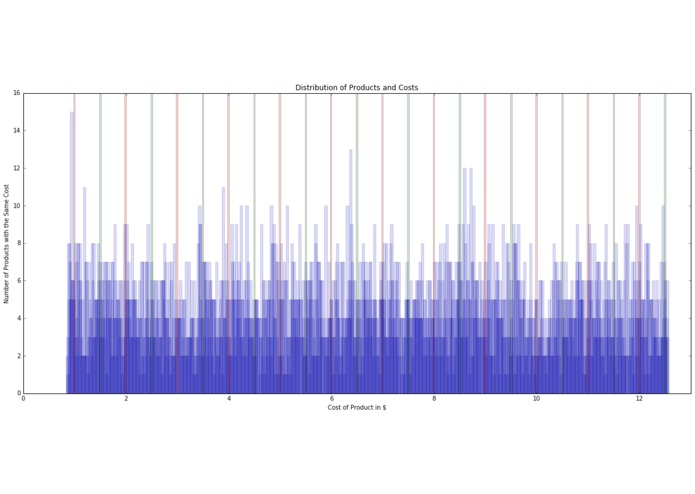
One of the many graphs we generated and explain in our report
-
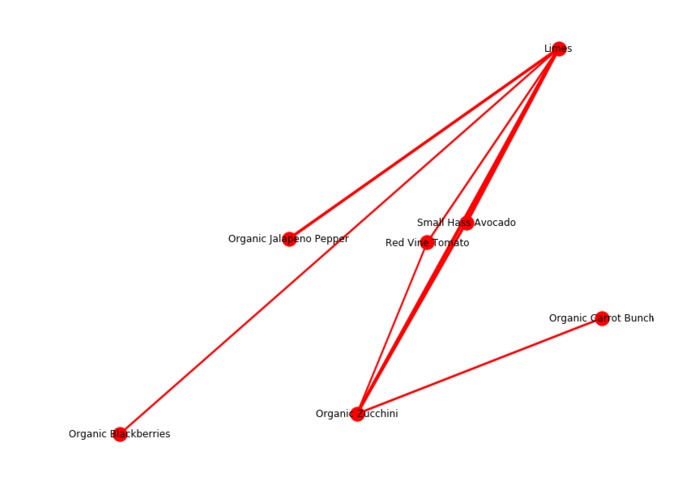
A graph network showing which products are most often purchased together.


Team Spidget Finner's Hack, HackGT 2017
rip Chantz Spears
Without analysis, data just takes up space. This year NCR exposed catalog of retail data to hackers, so we decided to explore their fascinating data sets. Our goals were to show off our ability to ask good questions of the data, learn more about unfamiliar libraries, and generate business-profitable insights from the data.
Background
As a leader in transaction technology, NCR collects huge amounts of data related to customer purchases. We explored the following two data stores from the larger collection of NCR data.
- catalog. This is a structured table with data about unique, individual products that have passed through NCR's system, as well as the price of the item and the department (read "product category") it comes from.
- transactions. This is a structured table with data about the purchasing history of a certain company. It includes the customer, the items bought and money spent, and the order associated with the purchase. By tracking both customer and customer order, we can tell the difference between when a customer purchases multiple products on the same single visit and when a customer buys products across multiple visits.
Methodology
Given our past shared experiences as summer interns, we all have a solid understanding of the greater picture of technology. We don't hack just for the sake of hacking, and we don't work in technical spaces just to feel smart or do something cool. In the real world, we work in order that we might empower others, whether that be users, customers, or businesses.
Believing this, the questions we asked of the data were focused on generating business value, primarily for the store owner.
We spent the first couple of hours just exploring the data. What was the significance of each column? What kind of purchases were in the data set (we expected to find "gas" or "fuel" purchases, but found none)? And what kinds of questions could we ask the data, so that it could tell us its story?
We maintained a continuously growing list of questions, as we began splitting up the questions and analyzing the data to let it tell us its story. We wrote our analysis only after seeing what the data had to say. Each analyst worked within their own Jupyter notebook space, and we compiled the analysis together at the end.
The Team
- Marissa Sorkin, The Adventurer: Mysterious drifter. Responsible for analysis of transaction data, analysis and insight, and department analysis.
- Lilianna "Lily" Swanson: Kennesaw State, 1st Year. Responsible for text analytics, product refinement, and graph visualization.
- Josh Koh, The Brain Behind This Operation: Georgia Tech, 4th Year. Responsible for project management, troubleshooting, design of analysis, and analysis insight.
- Chantz Spears, the arizonian who did nothing: North Arizona University, 4th Year. Wasn't accepted to the event. :'(
Built With
- jupyter-notebook
- python


Log in or sign up for Devpost to join the conversation.