-
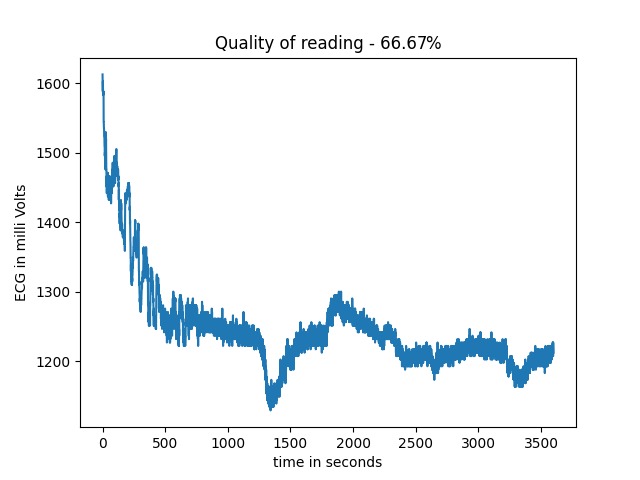
Sample generated ECG result
-
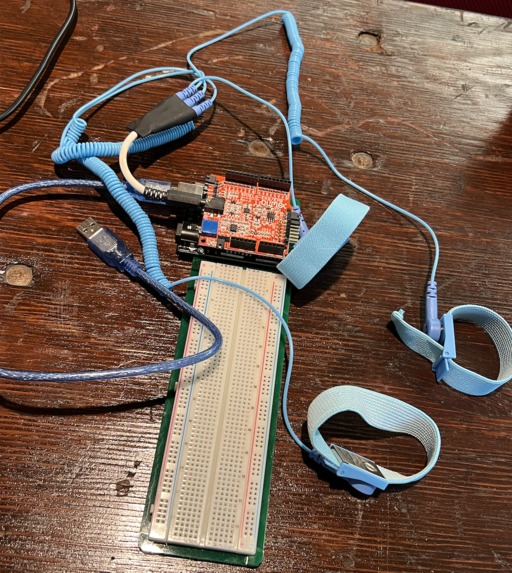
Arduino setup with ECG sensor
-
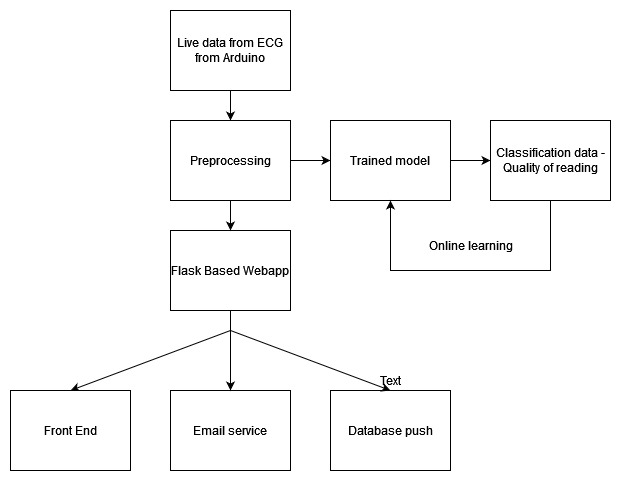
System design
-
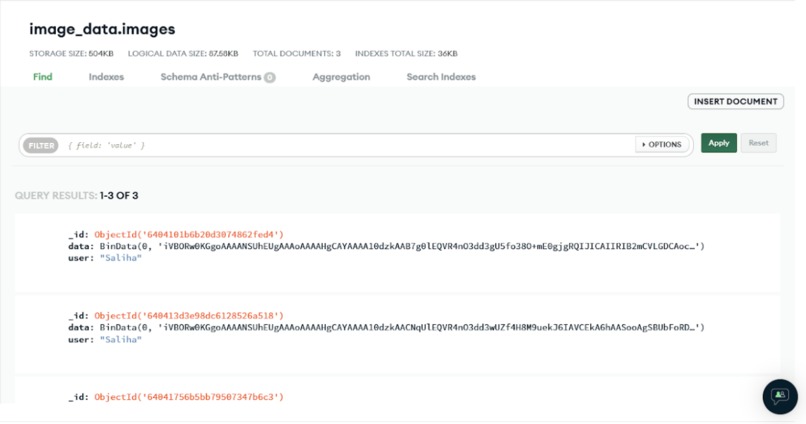
Images stored in MongoDB


Project Name
HeartHackers
Inspiration
Our project was inspired by VasoMedical’s ‘ECG Data Quality Index Challenge’! Electrocardiograms (ECGs) can be important clinical tools in diagnosing heart disease; with this being the leading cause of death worldwide, collecting ECGs with low-cost, DIY solutions could improve the quality of cardiological care for patients in rural or low-resource healthcare settings. We made a system for collecting ECGs using inexpensive Arduino peripherals, then identifying any abnormal heartbeat rhythms with machine learning, and integrated this all into an interface where patients may request our services and receive their results via email. In this way, once patients are notified of any detected heart abnormalities, they could forward readings to their doctors to investigate and interpret their results! Moreover, we should be able to process data from devices with cardiological sensors, like fitness trackers or smartphones, which further increases accessibility for patients.
What it does (or is supposed to)
Our ECG setup takes readings from in-person, via bookings requested from our website. We push the data to our analysis suite, determine the quality of the reading, and classify any abnormalities using a machine learning model. Then, we generate a visualization of the ECG reading along with its associated quality index, and provide this information in a report for easy access by email, while storing this information in our database for further analysis. Alternatively, we can process any provided cardiological data from personal devices (fitness trackers, smartphones) in the same manner.
How we built it
- Data analysis
- Identify abnormal heart rhythms using a deep learning LSDM-based model, trained on data from the MIT-BIH long-term ECG data set
- Used the Kurtosis statistical signal quality index to evaluate signal quality
- Best performing statistical quality index in identifying noisy data, according to the linked paper
- Simple statistical formula, not computationally intensive
- Implementation identifies the amount of noise-free time intervals, returns as a percentage over time intervals
- Data collection
- Integrated Arduino and EKG shield, connected electrodes to our test subjects
- Used serial output from the Arduino
- Input volt for Arduino is 5 volts
- ADC sampling frequency was 100 Hz
- Passed sensor reading to serial port (Com6 with 9600 baud rate)
- Front-end
- Upon receiving an API request at
{host}/record_data, with the body parameters of JSON format:{“user”: “user”, “Email_id”: “email” } - It will start reading serial port for particular time frame (3600)
- Converts port into a signal
- Classify heartbeats using the trained model
- Generate ECG visualizations, plus quality indicator
- Integrated Twilio’s API’s to send an email with an image attachment
- Integrated MongoDB to store the image for future reference
- Upon receiving an API request at
Challenges we ran into:
- Interpreting the output data from our Arduino peripherals
- Trying to read the data format of our training data set
- Determining a physical protocol to ensure quality ECG readings
- Going through the literature for a quantitative signal quality index
- Inability to reconcile transferring our generated data with the data format of our training data set and subsequent input for our machine learning model, due to lack of documentation
Accomplishments that we're proud of
- Interpreting ECGs
- Setting up our Arduino hardware to take ECGs
- Determining a suitable quantitative signal quality index for our readings, after reviewing 20+ research papers
- Converting from the quasi-undocumented data format of our dataset to processable .csv files, using MATLAB
- Designing our website
What we learned
Prior to Hack@CEWIT, our team had no prior experience in biotech or knowledge of cardiology. We had to learn how to read ECGs, set up our Arduino hardware and peripherals to take ECGs, and train a machine learning model to work with biometric data. Once we figured out how to get the hardware running, we tested out our setup by taking our own heart rates. We then moved to processing our data, and figured out how to evaluate the signal qualities, and how to train our machine learning model to classify abnormal heartbeats using data from the MIT-BIH long-term ECG database.
What's next for HeartHackers
- Add prediction for live data
- Monetizing our service
- Apply more denoising and signal processing to our ECG data
- Add more components to the website and integrate backend

Log in or sign up for Devpost to join the conversation.