-
-
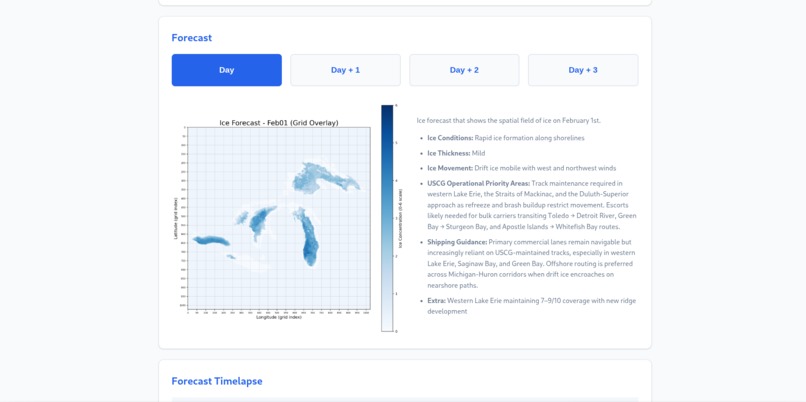
Prediction Website Preview
-
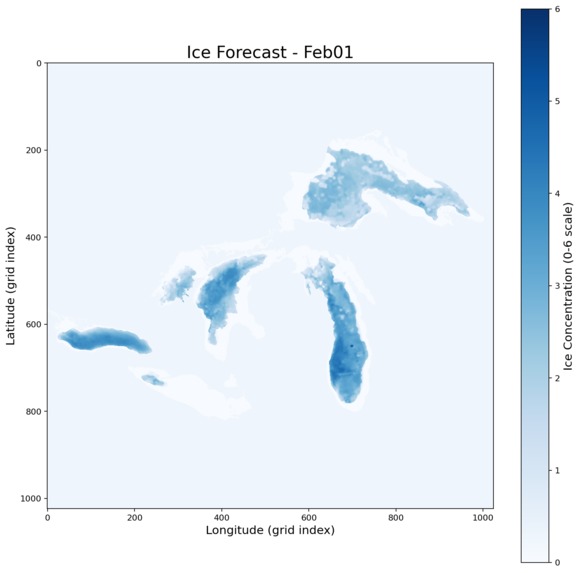
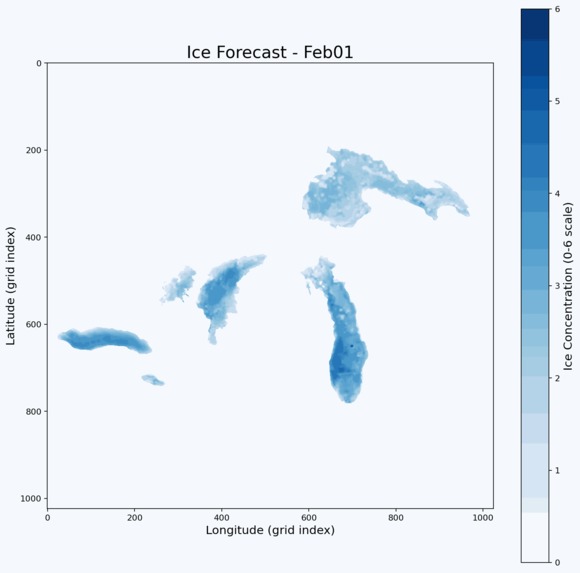
High-resolution predicted ice concentration map for February 1, oriented north-up with fixed 0-6 scale.
-
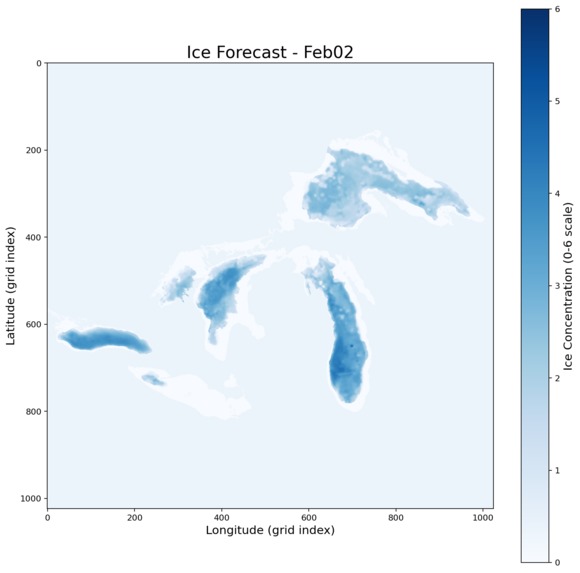
High-resolution predicted ice concentration map for February 2, showing early forecasted spatial changes.
-
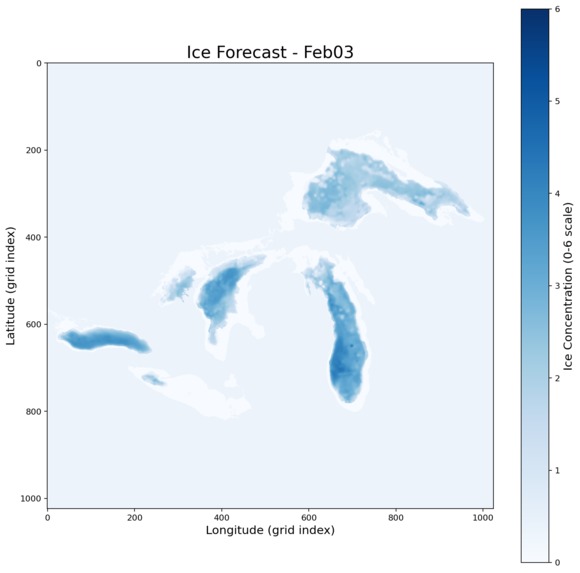
Predicted February 3 ice concentration map demonstrating day-to-day trends learned by the forecasting model.
-

Predicted February 4 ice map showing continued model-estimated ice development across all major lake regions.
-
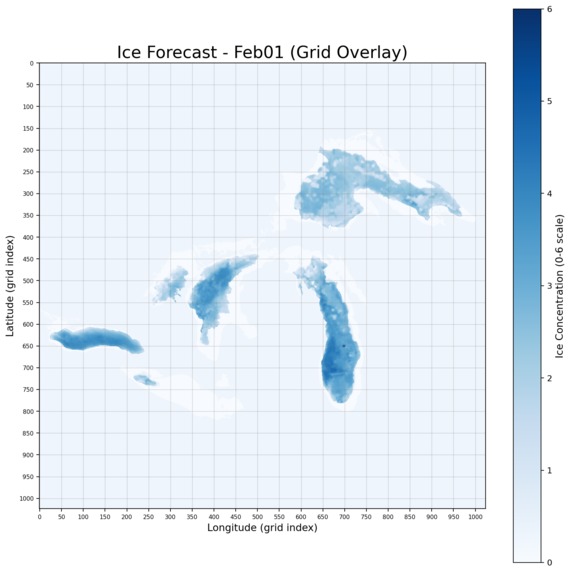
February 1 ice forecast with a dense 50-pixel grid to support zoomed navigation and localized ice planning.
-
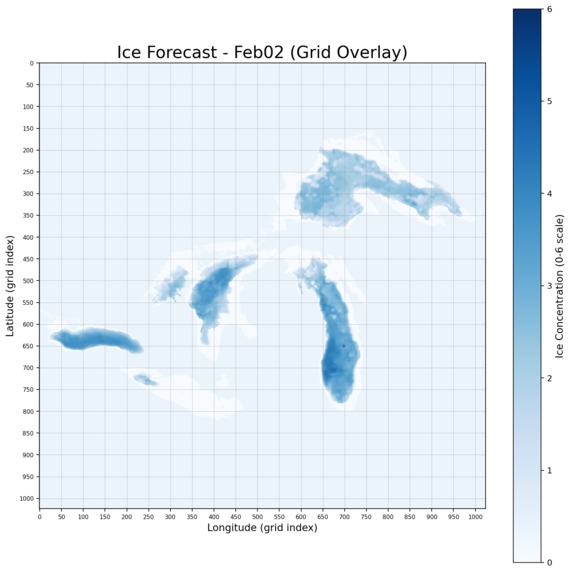
February 2 ice forecast with grid overlay for detailed inspection of developing ice structures and regions.
-
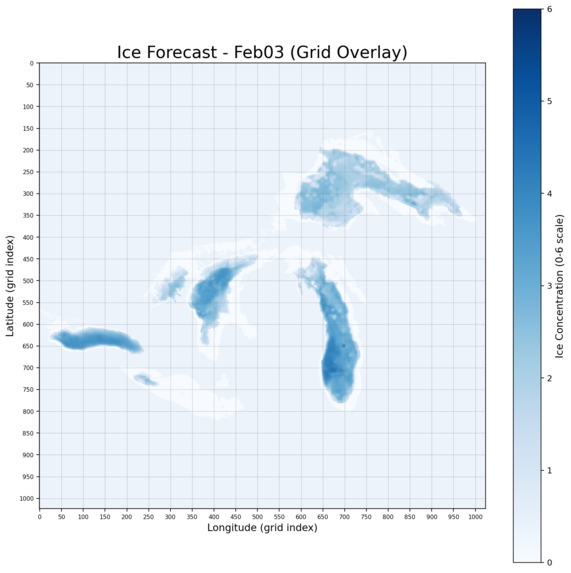
Grid-enhanced February 3 map allowing precise coordinate-based ice evaluation across the Great Lakes basin.
-

Grid overlay visualization for February 4 enabling detailed spatial referencing for mission planning needs.
-
 GIF
GIF
Animated four-day Great Lakes ice forecast generated by our U-Net model using January historical data.


Team Laker IceLabs
Elijah Morgan - Data Reading
Darren Fife - Data Reading
Marcos Sanson - Machine Learning Model Development
Diego de Jong - Frontend Development
Inspiration
We were inspired by the story behind The Wreck of the Edmund Fitzgerald by Gordon Lightfoot and by the importance of supporting safety for sailors on the Great Lakes. As students at Grand Valley State University, we live, study, and work beside these lakes every day, so building a project that could help those who navigate them felt especially meaningful. We wanted to create something that reflects both our technical abilities and our close connection to this region.
What it does
Our project builds a complete data and machine learning pipeline that uses historical NetCDF ice data to generate next-day and multi-day ice concentration forecasts for the Great Lakes. The system produces high-resolution 1024×1024 forecast maps and animations that are easy for humans to interpret and suitable for operational ice decision-making.
How we built it
We created an end-to-end workflow that organizes and preprocesses the January NetCDF files and extracts the daily 1024×1024 ice concentration grids. We then built clean seven-day input sequences for forecasting and trained a U-Net model to predict the next day’s grid. Iterative prediction extended the forecast across several days, and all outputs were rendered as HD PNG maps and GIF animations.
The frontend of the project is a GitHub Pages site designed to make the results clear and readable.
Challenges we ran into
- Some of the provided data had missing days and inconsistencies, which required careful manual organization and verification.
- We had to quickly learn how to work with NetCDF files and geospatial grid data with almost no prior exposure.
- Our team included students from multiple academic levels and backgrounds. We had to balance capstone work with part-time internships and still collaborate efficiently under tight timelines.
- Training a stable model required several improvement cycles to address drift and unrealistic ice patterns.
Accomplishments that we're proud of
- Working together across different experience levels and heavy schedules to build a fully functional forecasting system.
- Producing stable and realistic predictions using only the provided dataset.
- Creating a clean visualization workflow that outputs high-quality maps and animations for operational use.
- Designing a polished GitHub Pages site that ties together forecasting and presentation.
What we learned
We learned how to process NetCDF geospatial data and how to train and refine U-Net models for environmental forecasting. We also learned how to coordinate quickly as a team and how to combine our different strengths into a single unified project. This project deepened our understanding of the Great Lakes system, which holds personal significance to us as GVSU students who live alongside these waters.
What's next for Laker IceLabs
We plan to extend the model by incorporating weather variables and by improving multi-day prediction stability. We also want to add tools for zooming and region-specific ice analysis to support targeted ice-clearing decisions.
Our team members are also moving forward academically. Darren and Elijah are graduating this month, and the rest of us will continue building our skills as we complete our undergraduate degrees, carrying forward the experience of working on a project tied so closely to the region we call home.


Log in or sign up for Devpost to join the conversation.