-
-

Formula
-

Flowchart


Inspiration
As a software engineer trying to explain or document complex algorithms from your code is not always an easy task, it can be a challenge to make colleagues on your team understand how your algorithms work. One way to clearly describe complex source code is through graphic representation such as flowcharts. However, making flowcharts can come with some problems such as:
- Complex code: When the code is very complex a lot of effort is needed to draw the flowchart.
- Costly: If the application or the system is very large, the time taken to draw the flowcharts is also large, and hence the cost of development goes out of proportion.
- Difficult to modify: If there is any change in the source code or algorithm, it is necessary to redraw the flowchart. For complex flowcharts that is not a simple task.
- No update: As per the software requirements, the programs are updated regularly. However, the corresponding changes in the flowchart may not be documented quickly enough.
I believe that with a powerful collaboration document such as Coda combined with a Pack to generate flowcharts from source code all the problems listed above can be solved, and that's why I built JS Flowchart.
What it does
JS Flowchart is a Coda Pack that allows you to pass in any Javascript code as input and receive a complete flowchart algorithm from it. The pack has a Formula called DrawFlowchart, this formula takes in JavaScript source code as a string input and outputs the algorithm of that code as an SVG image.
Formula:
The formula accepts javascript code, a theme, and an abstraction level.
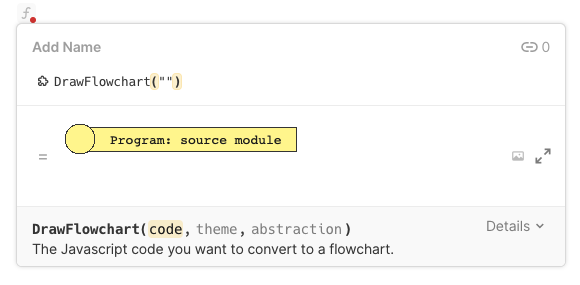
Javascript code input:
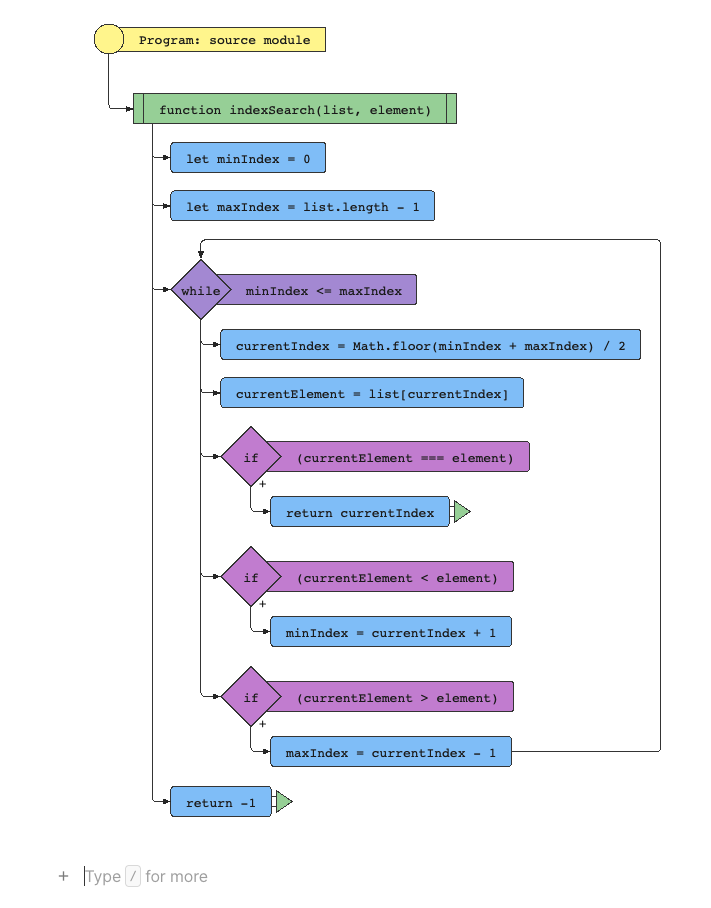
Here is a code function for the classic case Binary search.
function indexSearch(list, element) {
    let currentIndex,
        currentElement,
        minIndex = 0,
        maxIndex = list.length - 1;

    while (minIndex <= maxIndex) {
        currentIndex = Math.floor(minIndex + maxIndex) / 2;
        currentElement = list[currentIndex];

        if (currentElement === element) {
            return currentIndex;
        }

        if (currentElement < element) {
            minIndex = currentIndex + 1;
        }

        if (currentElement > element) {
            maxIndex = currentIndex - 1;
        }
    }

    return -1;
}
Result:
The result is a flowchart of the binary search algorithm.
Abstraction Levels:
The formula also allows you to demonstrate your code logic from different abstractions levels.
Let's say you would like to omit some details, e.g. for a given module, you are interested only in what the module exports, or, what classes it contains. There is a list of defined levels you can do that with, you can include one or more of these abstraction levels in your formula as a list:
FUNCTIONFUNCTION_DEPENDENCIESCLASSIMPORTEXPORT
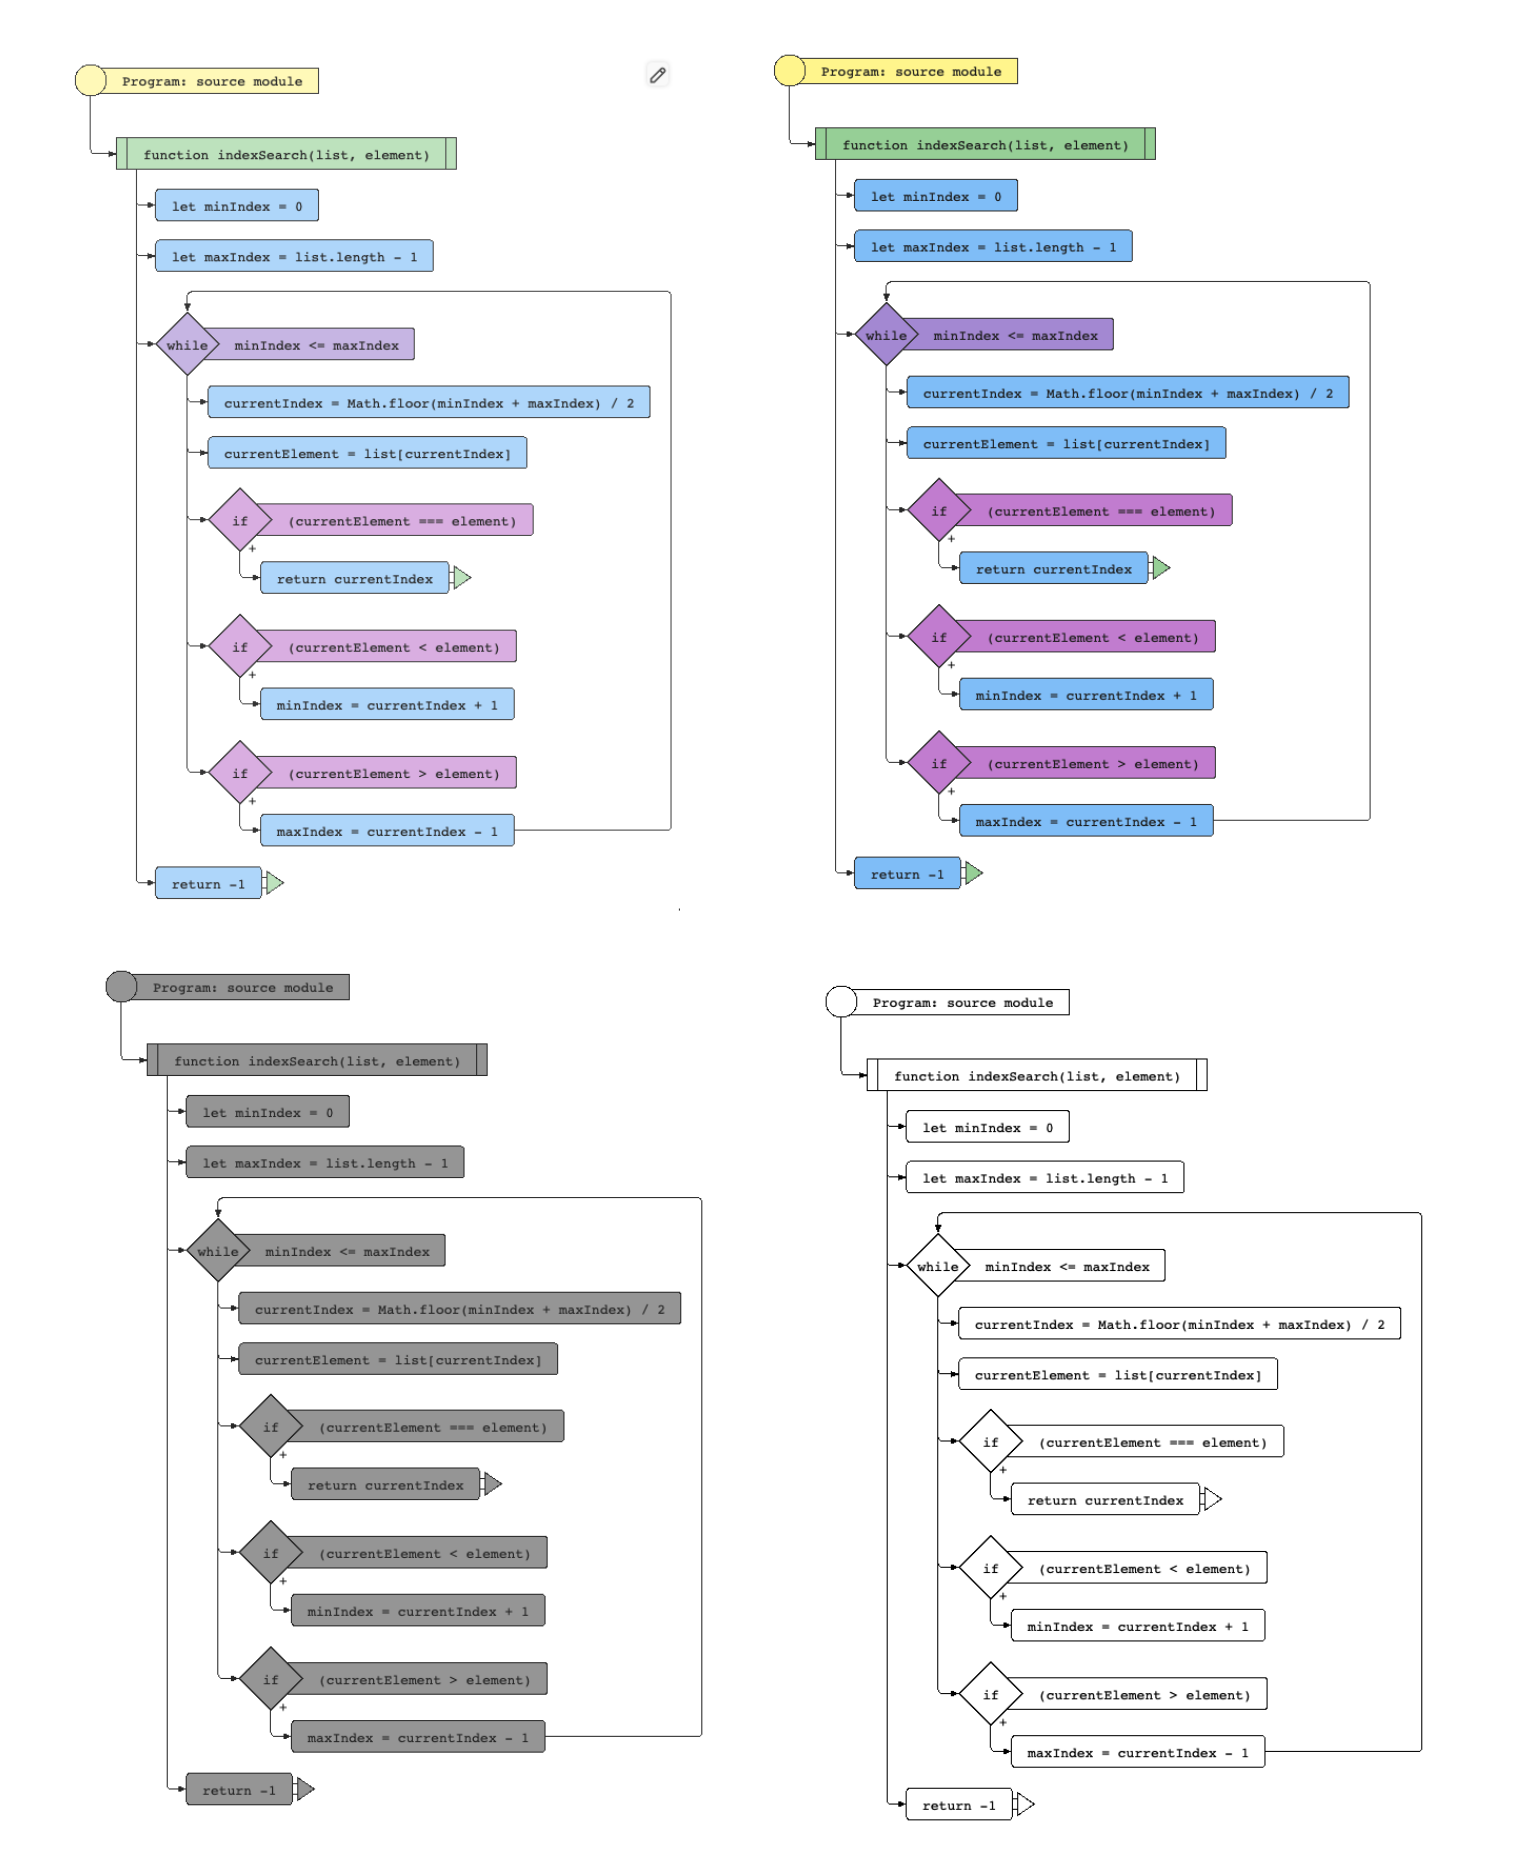
Flowchart Themes:
You can apply different themes to your Flowchart by passing in one of the pre-defined themes:
DEFAULTGRAYLIGHTOUTLINE
These are the current 4 themes available to the pack, I look forward to adding more.
Use Cases:
- explain/document your code by flowcharts in a Coda doc
- learn other's code by visual understanding
- create flowcharts for any process simply described by valid JS syntax right inside a Coda doc
How we built it
I built JS Flowchart with the help of the Coda Pack SDK and with the help of the CLI guide I was able to set up a coda development environment on my local machine. To generate the flowchart I made use of a node package called js2Flowchart and hooked it up to a coda formula. I made the formula with 3 parameters for the JS code, theme, and abstraction levels. I then made the formula return an SVG image converted to a base64 string.
Accomplishments that we're proud of
I'm proud of creating a tool that will be useful to me as a software engineer.
What we learned
I learned how to create Coda packs.
What's next for JS Flowchart
I plan to make this tool have formulas to convert other programming languages into flowcharts. I plan to add more themes too.
Built With
- coda
- javascript
- svg


Log in or sign up for Devpost to join the conversation.