-
-
Full Data analysis
-
Mobile-Ready
-
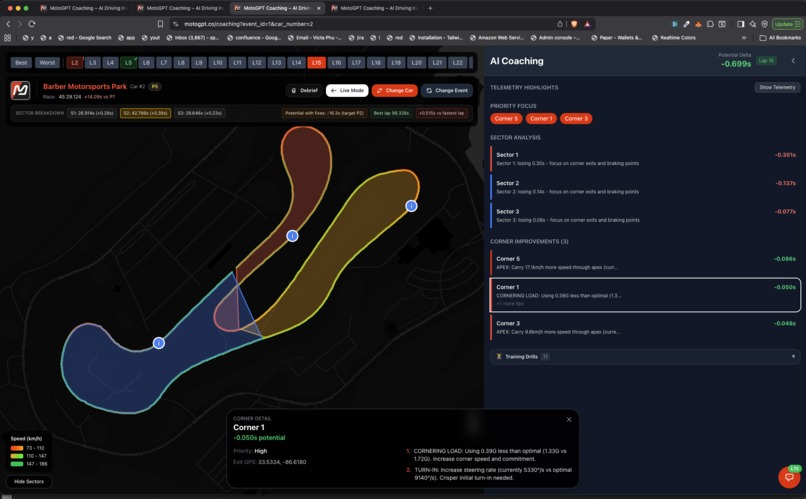
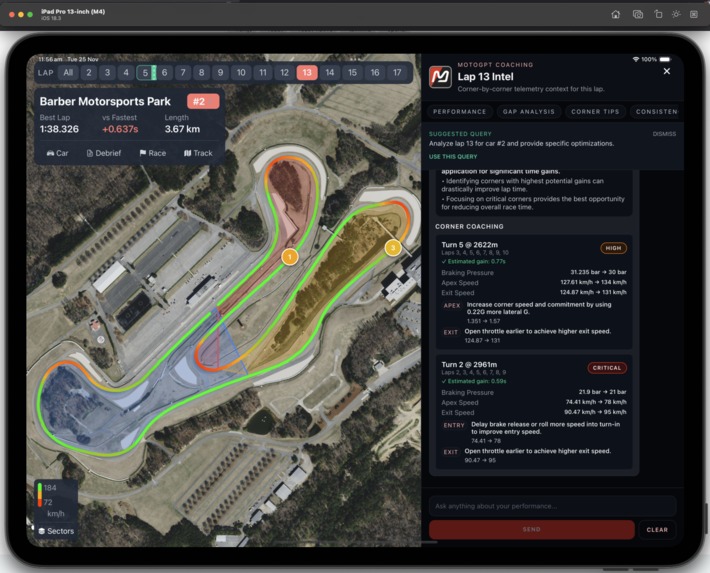
Corner-Level Analyticsd
-
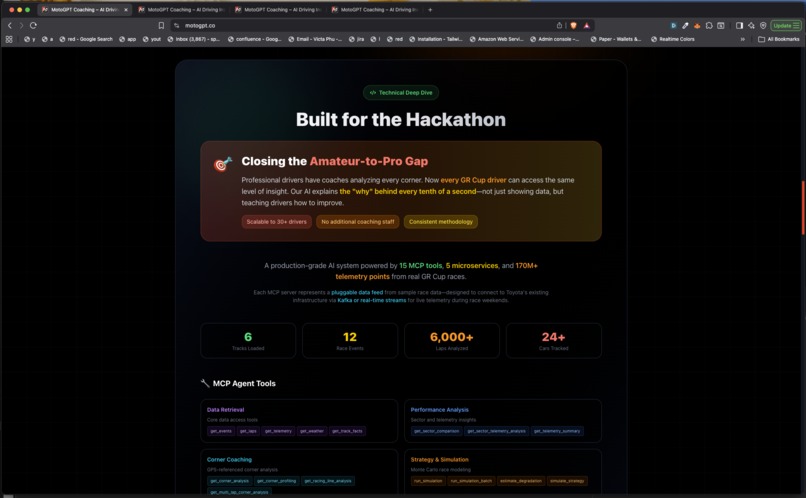
Built for the Hackathon
-


Inspiration
A single GR Cup race generates over 3 million telemetry data points—speed, braking pressure, throttle position, GPS coordinates, lateral G-forces—captured 100 times per second, creating 23 million data points per season. This data holds the key to faster lap times and better racecraft. But it's trapped in spreadsheets and CSV files that only engineers with $10,000 software can interpret. We saw an opportunity to democratize professional-level race analysis and embody Toyota's Kaizen philosophy: continuous improvement, accessible to everyone. MotoGPT was born from a simple question: What if every GR Cup driver could have an AI race engineer in their pocket?
What it does
MotoGPT transforms overwhelming telemetry into three things: where you're losing time, why you're losing it, and exactly how to fix it—in plain English anyone can understand.
Core Features:
- GPS-Accurate Track Analysis: Interactive track maps with speed heatmaps show exactly where drivers are losing time, corner by corner
- AI Conversational Coach: Natural language interface lets drivers ask questions like "Why is Sector 2 my weakest sector?" and get instant, data-driven answers with specific technique recommendations
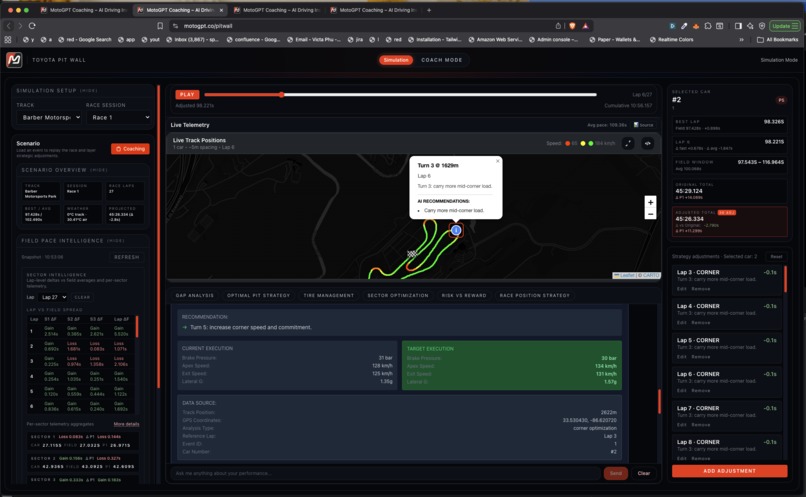
- Telemetry Comparison: Overlay 8 metrics (speed, brake pressure, throttle, steering angle, RPM, gear, G-forces) against field best or benchmark laps with sector-by-sector breakdowns
- Session Debrief: Comprehensive post-session analysis showing gap to field leader, sector performance, consistency scoring, and position improvement potential
- Personalized Training Drills: AI-generated practice routines targeting specific weaknesses identified in the telemetry
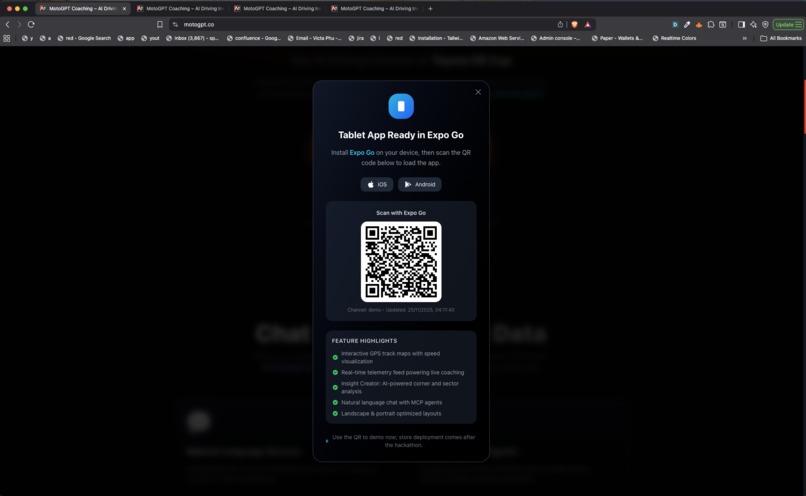
- Multi-Platform: Full-featured web app for in-depth analysis plus native iPad app ready for trackside use
Real Impact Example (Car 2, Barber Motorsports Park):
- Finished 5th, but analysis showed 2nd place potential
- Identified Sector 2 as weakness (-0.386s per lap)
- Total potential gain: 16.3 seconds over the race = 5 positions
- Improvement trend during session: 5.09 seconds (learning curve tracked in real-time)
How we built it
Tech Stack:
- Backend: NodeJS server with PostgreSQL database storing millions of telemetry points
- AI/ML: GPT-4o Mini (configurable) for agentic coaching system with streaming responses
- Frontend Web: Next.js 14 with TypeScript, React, Recharts for advanced data visualization
- Mobile: React Native/Expo for native iPad app with offline-capable architecture
- Data Pipeline: Custom parsers for AiM telemetry formats, GPS coordinate processing, sector analysis algorithms
- Infrastructure: Docker containerization, cloud deployment for scalability
Architecture Highlights:
- Multi-agent AI system with specialized tools for telemetry analysis, sector breakdown, and technique recommendations (MCP tools that the Agent can use)
- Real-time telemetry time series API with field comparison bands (min/max across multiple cars)
- GPS-based corner detection and speed heatmap generation
- Streaming chat interface for conversational coaching
- Responsive design optimized for both desktop analysis and trackside tablet use
Development Process: We started with data—ingesting real GR Cup telemetry from Barber Motorsports Park and Road Atlanta. We built the telemetry API first, then layered on AI coaching, then created intuitive visualizations. The iPad app came last, ensuring trackside usability. Every feature was tested against real race data to ensure accuracy and relevance.
Challenges we ran into
1. Data Scale and Performance
- Processing 180,000+ telemetry samples per car per session required careful optimization
- Solution: Implemented smart downsampling (500-point limit for charts while preserving data integrity), server-side aggregation, and lazy loading for telemetry overlays
2. Making Complex Data Understandable
- Raw telemetry traces are meaningless to non-engineers
- Solution: Built AI conversational interface that translates technical data ("42 bar vs 48 bar brake pressure") into actionable coaching ("brake harder initially, not longer")
3. GPS Coordinate Accuracy
- Track boundaries and corner detection from raw GPS data proved challenging
- Solution: Developed distance-based sector analysis and speed heatmaps that work even with imperfect GPS data
4. Multi-Platform Consistency
- Ensuring feature parity between web (Recharts) and mobile (React Native Chart Kit) with different charting libraries
- Solution: Shared API layer and normalized data structures; focused web on deep analysis, mobile on quick insights
5. AI Response Quality
- Early AI responses were too generic or overly technical
- Solution: Engineered prompts with real telemetry context, sector-specific insights, and technique-focused recommendations; added streaming for real-time feedback
6. Real-Time User Experience
- Users needed instant feedback when selecting laps or asking questions
- Solution: Optimistic UI updates, background data fetching, and streaming AI responses to reduce perceived latency
Accomplishments that we're proud of
1. Democratizing Software
- Made professional-level race analysis accessible via web browser and iPad app—no expensive subscriptions or engineering degree required
2. Natural Language Coaching
- Built an AI that doesn't just show data—it explains why you're slow and how to fix it, in conversational English
3. Quantifiable Impact
- Our analysis doesn't just say "improve Sector 2"—it calculates exact time gains (e.g., 0.386s per lap) and position improvements (7th → 2nd place potential)
4. Multi-Platform Execution
- Delivered both a full-featured web app for deep analysis AND a native iPad app ready for trackside use in 48 hours
5. Real Data, Real Insights
- Processed actual GR Cup race data (27 laps, 81 sector times, 180,000+ telemetry points) and generated actionable coaching that accurately reflects driver performance
6. Toyota Kaizen Embodiment
- Every feature—from sector analysis to training drills to improvement tracking—reinforces continuous improvement philosophy
7. Clean, Intuitive UX
- Complex telemetry data presented through speed heatmaps, sector badges, interactive charts, and conversational chat—designed for drivers, not data scientists
What we learned
Technical:
- AI agents need context: Generic LLMs fail at race coaching. We learned to embed rich telemetry context (sector deltas, brake pressure differences, GPS coordinates) directly into prompts for accurate, specific recommendations
- Data visualization matters: A well-designed speed heatmap or telemetry overlay communicates more than 1000 rows of CSV data
- Real-time matters: Streaming AI responses and optimistic UI updates transformed the user experience from "waiting for analysis" to "having a conversation"
- Mobile-first for trackside: Tablet optimization isn't just smaller screens—it's touch targets, offline capability, and glanceable insights during session breaks
Domain Knowledge:
- Driver psychology: Drivers don't want to hear "you're 0.386s slow in Sector 2"—they want to know "brake at the 100m board with 48 bar pressure"
- Kaizen in practice: Small, measurable improvements (0.1s per corner) compound into race-winning gains (3 positions)
- Data accuracy: One bad GPS point or telemetry outlier can skew an entire analysis—data cleaning is critical
Product:
- Conversational UX beats dashboards: Allowing drivers to ask their data questions ("Why was Lap 5 my slowest?") is more powerful than static reports
- Show impact, not just data: "16.3 seconds = 3 positions" resonates more than "0.9s gap to field best"
What's next for MotoGPT
Short-term (Next 3 Months):
- Live Session Integration: Real-time telemetry analysis during practice sessions with push notifications for critical insights ("You just set your best Sector 1—replicate that braking point")
- Video Overlay: Sync onboard camera footage with telemetry traces for visual confirmation of technique errors
- Expanded Track Database: Add all GR Cup circuits with pre-mapped sectors and corner metadata
- Driver Benchmarking: Anonymous comparison against field averages and top performers
Medium-term (6-12 Months):
- Predictive Coaching: ML models that predict lap time based on current technique and suggest optimal racing line adjustments
- Race Strategy Simulation: Pit stop timing, tire degradation analysis, and fuel strategy optimization
- Team Collaboration: Multi-user workspaces for driver/engineer collaboration with shared annotations and notes
- Weather Integration: Correlate telemetry performance with track temperature, humidity, and conditions
Long-term Vision:
- Expand Beyond GR Cup: Adapt MotoGPT for other spec series (Miata Cup, F4, karting) and eventually open-wheel/GT racing
- Hardware Integration: Direct telemetry ingestion from AiM devices, eliminating manual CSV uploads
- Community Marketplace: Drivers share anonymized telemetry; learn from faster laps across the entire field
- AI Race Engineer Premium: Personalized multi-session coaching plans with progress tracking and goal setting
Ultimate Goal: Make MotoGPT the standard tool for every grassroots racer—turning data into speed, and speed into podiums. We want to prove that with the right tools, continuous improvement isn't just for factory teams—it's for everyone who loves racing.
Built With
- nextjs
- openai
- react
- react-native
- tailwind


Log in or sign up for Devpost to join the conversation.