-

Rubber Duck
-
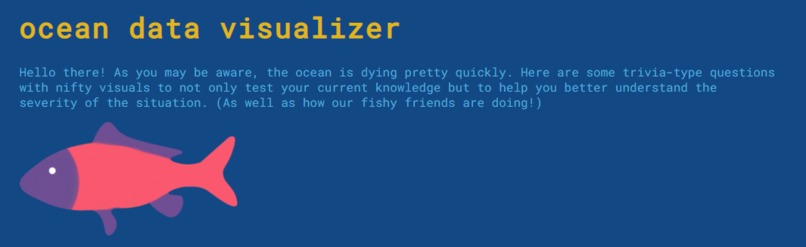
Home page (light mode)
-
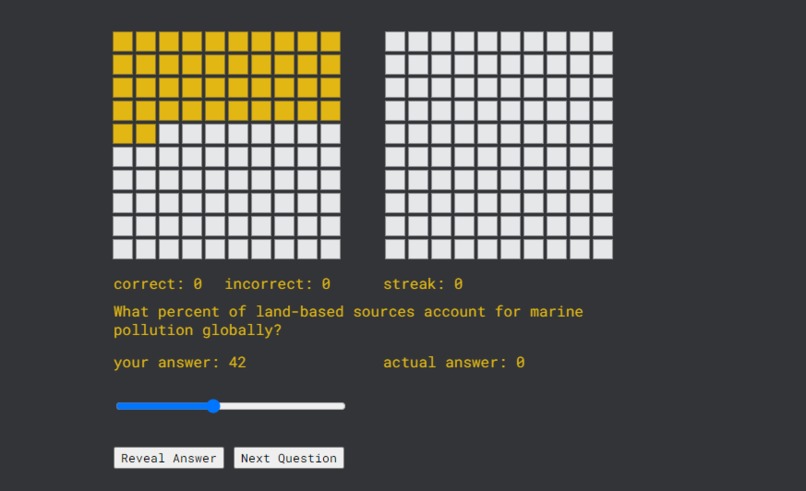
A glimpse of the program (dark mode)


Inspiration
The idea for the data visualization aspect of this project came from this TedTalk: https://www.youtube.com/watch?v=piCQ3_tcRUQ
The idea is that people's perceptions of statistics versus the reality of a situation can often differ, so visuals are an effective way for people to comprehend information. The goal was to make something similar, but with questions revolving around an ocean-awareness theme.
What it does
Ocean Data Visualizer (or OceanViz) is a concise website with a small program that allows users to guess the answer to questions regarding statistical information on the ocean and see how accurately their own understanding or impressions reflect the actual numbers. There is also a scoring system to track how well you know your stuff!
How we built it
- Graphics were created in Illustrator and Photoshop
- The interactive p5.js canvas was embedded into the website
Challenges we ran into
- Embedding the p5.js library into the page
- Drawing canvas images to screen in the right order
- Centring HTML elements
- Switching images according to the correct theme/colour mode
Accomplishments that we're proud of
This was the first time using the canvas element and javascript. Additionally, this was also the first time creating an entire web page from scratch!
What we learned
Beginner-level javascript with p5 and how to use Adobe illustrator.
What's next for OceanViz
Mobile responsiveness and a larger database of questions on ocean stats.


Log in or sign up for Devpost to join the conversation.