-
-
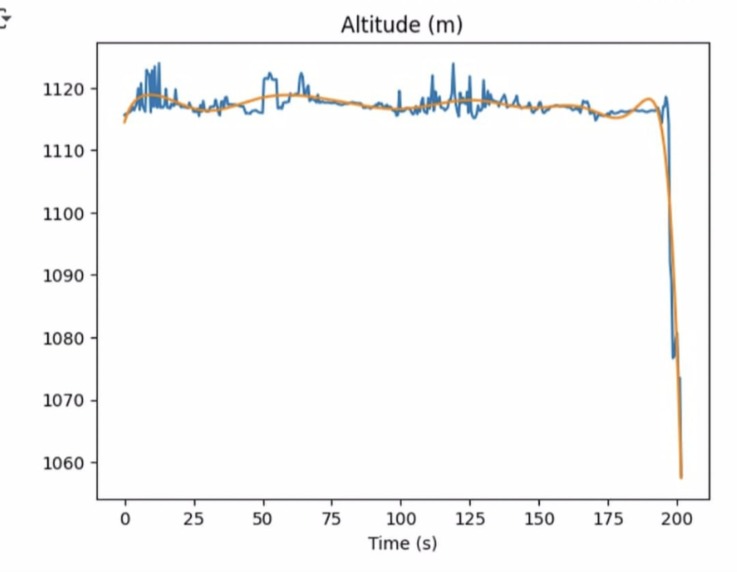
Graphs the altitude as a function of time.
-
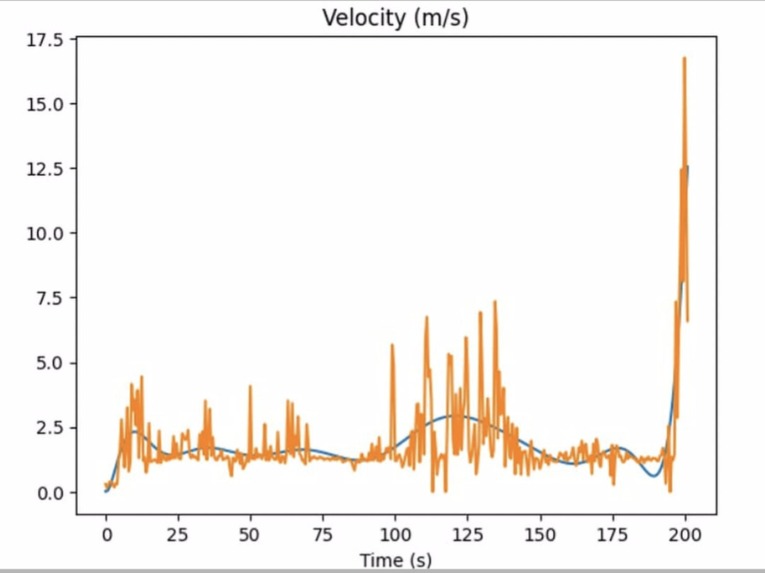
Graphs the velocity as a function of time.
-
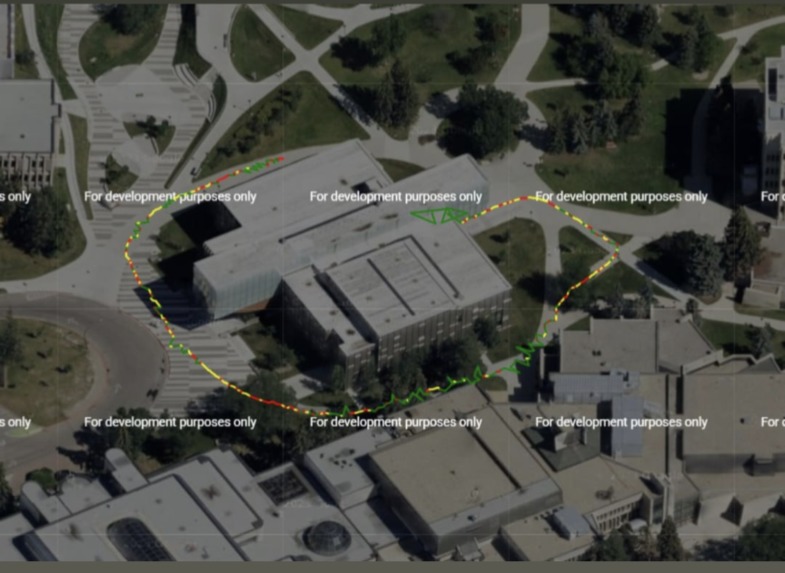
Maps the track onto a satellite image while simultaneously showing the speed in colors red, yellow and blue.


Inspiration/ What it does
We were inspired by orienteering maps where it shows the speed and the position as you travel. Therefore we built graphs that track your velocity over time as well as a graph that illustrates your position as a map and your speed in color.
How we built it
We built it using python, matplotlib and GNU coordinates.
Challenges we ran into
Some of the challenges we ran into was one: three of the rows being completely empty because the satellite lost signal for a second, so we ended up editing that row. Another was that towards the end of our data we went down 60 metres in altitude which is not possible, however we figured out that it was probably because we went under a roof causing the signal to lose strength.
Accomplishments that we're proud of
We're proud of being able to make a graphs using this data while working together as a team and using our time efficently.
What we learned
We learned a lot about geomatics from this hackathon for example we learned how to use positioning devices to get data and convert them into interesting graphs that tell a lot about the track.
What's next for Orientplot
For our next steps, it would be better to create a software application where users can input data similar to ours and it can create these graphs again without any manual assistance.
Built With
- matplotlib
- python


Log in or sign up for Devpost to join the conversation.