-
-
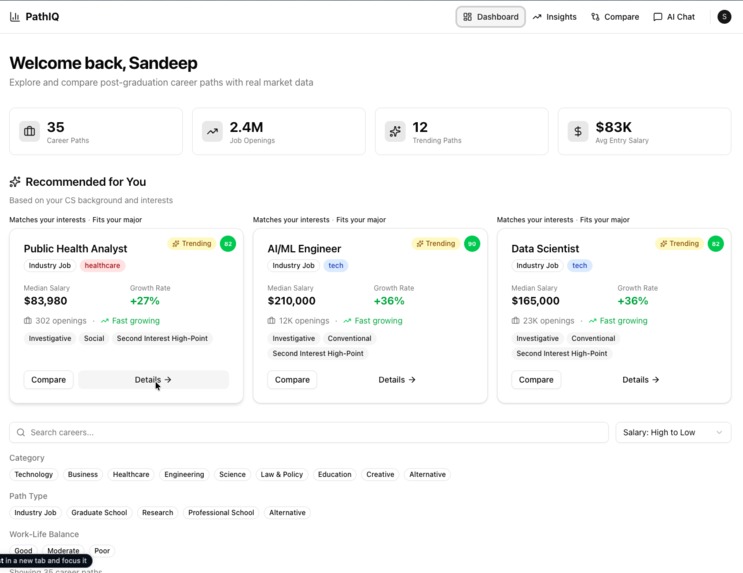
The dashboard, showing personalized job recommendations
-
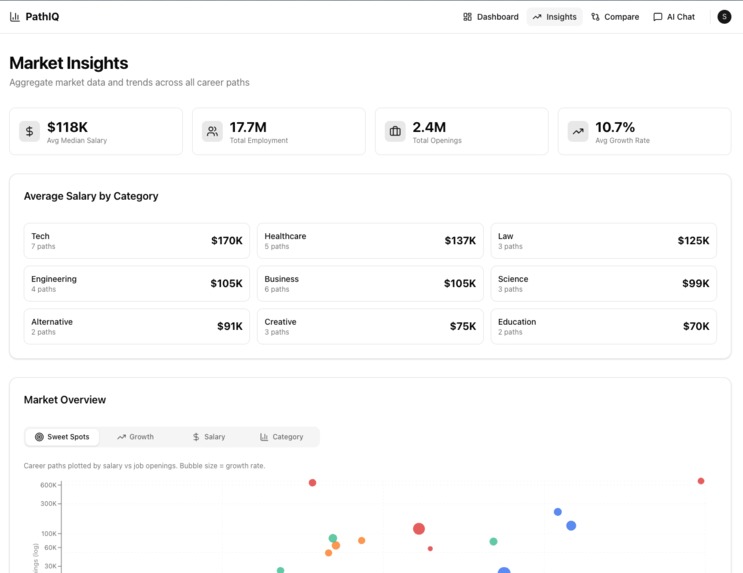
Market insights across all industries
-
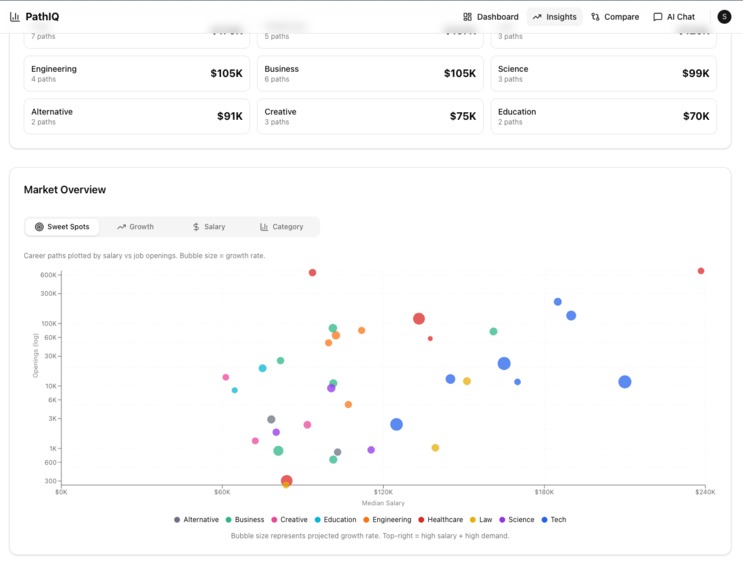
Graphs showing Salary vs Job openings, as well as options for growth, salary, and industry type
-
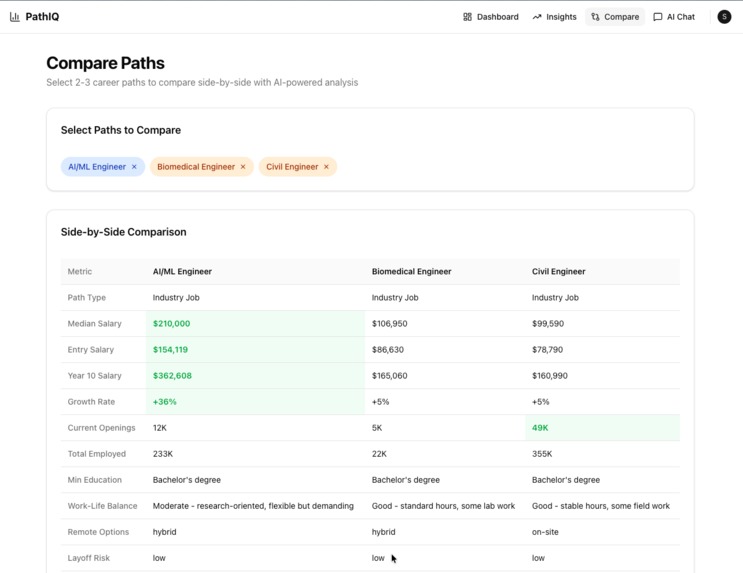
Career path comparator
-
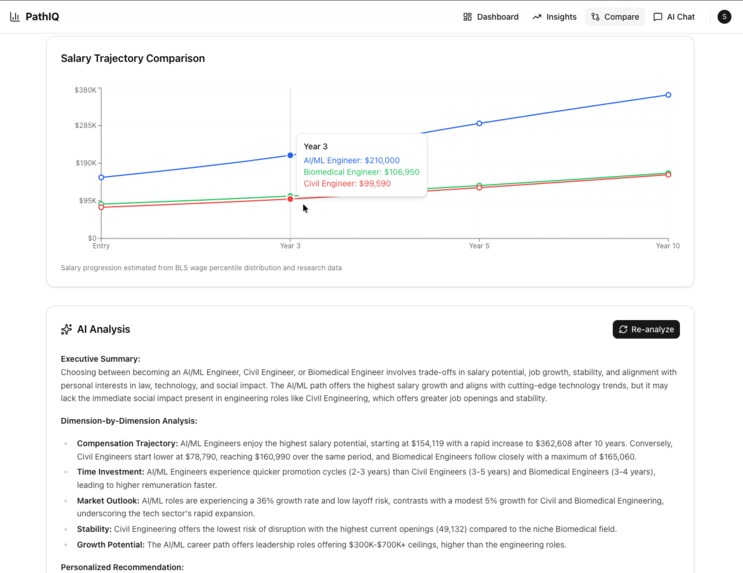
Graphs and AI analysis in the career path comparator
-
-
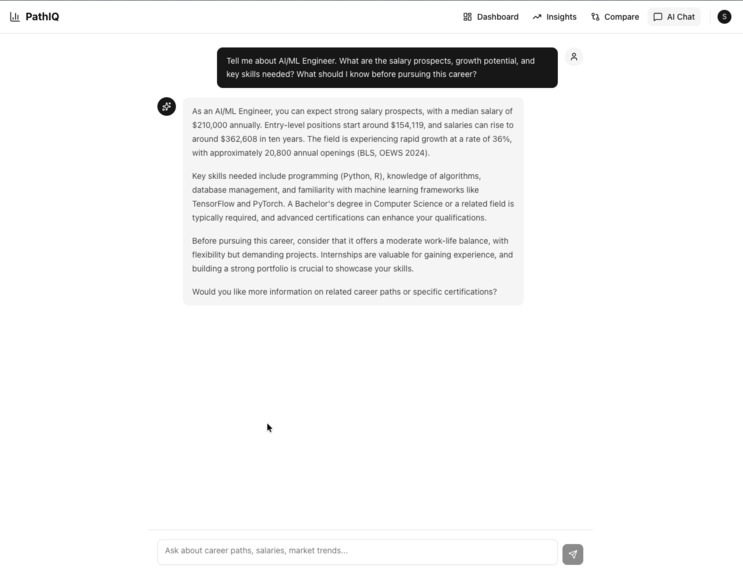
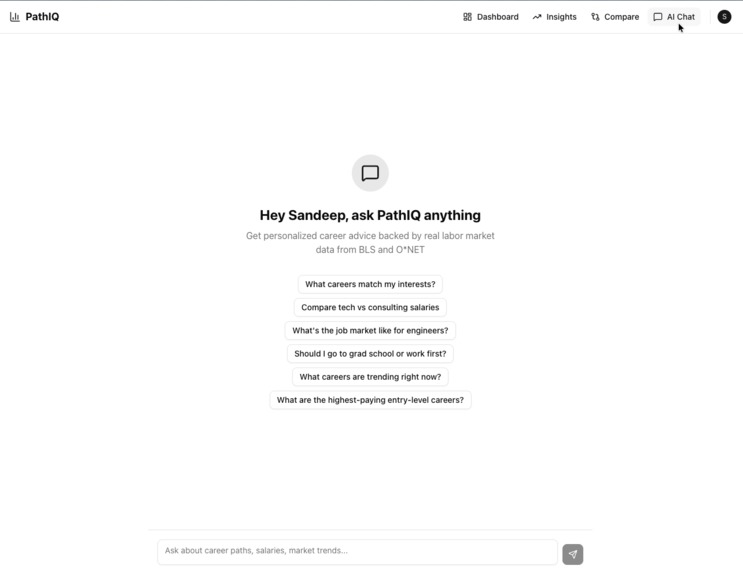
The chat interface, which pulls real data from the database instead of relying on old, hallucinated data


Inspiration
As college students ourselves, we've witnessed countless peers struggle with one of life's biggest decisions: what to do after graduation. Friends would spend hours on Reddit, ask family for outdated advice, or rely on anecdotal stories from older students. We realized students are making $200K+ decisions (opportunity cost + tuition + years of life) with information that's either outdated, incomplete, or biased.
The breaking point came when a friend turned down a lucrative job offer to pursue a PhD, only to discover later that the academic job market had contracted significantly. With real labor market data, they could have made a more informed choice. We wanted to build something that prevents these costly mistakes.
What It Does
PathIQ is a real-time career intelligence platform that helps undergraduates compare post-graduation paths using government labor market data and AI-powered analysis. Students can:
- Browse 35 career paths across 9 categories with current salary, job opening, and growth data
- Compare multiple options (industry jobs vs graduate school vs fellowships) side-by-side with AI trade-off analysis
- Ask natural language questions like "What careers combine CS and social impact?" and get data-backed answers
- Explore market intelligence through interactive visualizations (salary vs openings scatter plots, market health scores, historical trends)
How We Built It
Data Pipeline: We built a comprehensive data collection system that aggregates information from multiple authoritative sources:
- Bureau of Labor Statistics (BLS) OEWS API for salary data and employment statistics
- BLS Employment Projections for 10-year growth forecasts
- O*NET Database for skills, interests (RIASEC), and occupation details
- Real-time job posting counts scraped from Indeed and Adzuna API
- layoffs.fyi data for industry layoff risk assessment
- OpenAI GPT-4o-mini for generating AI-enhanced career descriptions and preparation advice
We created Python scripts for each data source, implemented validation logic to ensure data quality, and built a master orchestrator that combines everything into a unified database. The pipeline runs weekly to keep job opening counts fresh.
Application Stack:
- Frontend: Next.js 14 with TypeScript, Tailwind CSS, and shadcn/ui components
- Backend: Next.js API routes with server-side rendering
- Database: Supabase (PostgreSQL) with Row Level Security
- AI Integration:
- GPT-4o for complex multi-path comparison analysis
- GPT-4o-mini for conversational career chat with streaming responses
- Custom function calling to query our career database in real-time
- Visualizations: Recharts library with 11 custom chart types
- Authentication: Supabase Auth with email verification via Resend
Key Features:
- Personalized Recommendations: AI scoring algorithm based on interest-to-category mapping, major compatibility, market health, and user year (seniors get focused results, freshmen get broader exploration)
- Market Health Score: Weighted composite metric (0-100) combining growth rate (30%), job openings (25%), salary trajectory (25%), and inverse layoff risk (20%)
- Percentile Salary Calculator: Interactive tool that interpolates between BLS percentile data (p25/p50/p75/p90) to show where target salaries fall
- Historical Trends: 10-year time series data (2014-2024) for salary and employment, visualized with area charts
Challenges We Faced
Data Quality and Consistency: The biggest challenge was combining data from multiple sources with different schemas, update frequencies, and reliability levels. BLS uses SOC occupation codes, O*NET uses O*NET-SOC codes, and job boards use free-text job titles. We built a manual mapping system to align these, which took significant effort. Additionally, some BLS data had missing values or outliers, so we implemented validation checks that flag suspicious data (e.g., entry salary > median salary) and used fallback sources.
AI Hallucination Prevention: Early versions of our AI comparison feature would occasionally hallucinate salary numbers or job statistics. We solved this by:
- Injecting the complete career database into the system prompt (not relying on AI's training data)
- Implementing function calling so AI queries our database in real-time
- Requiring AI to cite specific data sources in responses
- Adding validation that rejects responses containing numbers not in our database
Real-time Data Freshness: Job posting counts change daily, but hitting Indeed's servers too frequently risks IP blocking. We implemented:
- Weekly automated scraping with user-agent rotation
- Fallback to cached data if scraping fails
- "Last updated" timestamps so users know data freshness
- Rate limiting on our own API to prevent abuse
UX Complexity: Presenting dense labor market data without overwhelming users required careful design iteration. We user-tested with 15 students and discovered:
- Initial dashboard was too data-heavy → added personalized recommendations section
- Comparison tables were hard to scan → added color coding and visual indicators
- Students didn't understand "market health score" → added breakdown showing component factors
We solved these through progressive disclosure: simple metrics upfront (salary, openings), detailed breakdowns on-demand (percentiles, historical trends).
What We Learned
Technical Skills:
- Data pipeline engineering: ETL processes, validation, fallback strategies
- LLM integration: function calling, streaming responses, prompt engineering to prevent hallucination
- Full-stack development: Next.js 14 App Router, server components, API routes
- Data visualization: Recharts, custom tooltips, responsive charts
- PostgreSQL: complex queries, RLS policies, indexing for performance
Product Design:
- The importance of user research: our assumptions about what students needed were often wrong
- Simplicity beats feature bloat: we cut 40% of planned features after user testing showed they weren't valued
- Data needs context: raw numbers are useless without comparison points and explanations
Problem Solving:
- When official APIs fail or have gaps, you need robust fallback systems
- Real-world data is messy since validation and cleaning are 50% of the work
- AI is powerful but needs guardrails, so we added function calling and data injection prevent hallucinations
What's Next
Short-term (Next 3 months):
- Expand from 35 to 100 careers (covering more niche fields)
- Add geographic insights using BLS metro area data (salary by city, job concentration)
- Beta launch with 3 partner universities
Medium-term (6 months):
- Mobile app (iOS/Android)
- Graduate program database (acceptance rates, funding, placement outcomes)
- Saved careers and comparison history for authenticated users
Long-term (1 year+):
- Skills-based career pivoting (analyze transferable skills between paths)
- International expansion (UK, Canada labor market data)
- Alumni outcome tracking (where do graduates actually end up?)
Our vision is to become the default decision-support platform for every college student making post-grad choices, replacing outdated career center advice with real-time, data-driven intelligence.
Built With
- adzuna
- bureau-of-labor-statistics-public-data
- indeed
- next.js
- o*net
- openai
- python
- react
- recharts
- resend
- shadcn/ui
- sql
- supabase
- tailwind
- typescript
- vercel

Log in or sign up for Devpost to join the conversation.