-
-
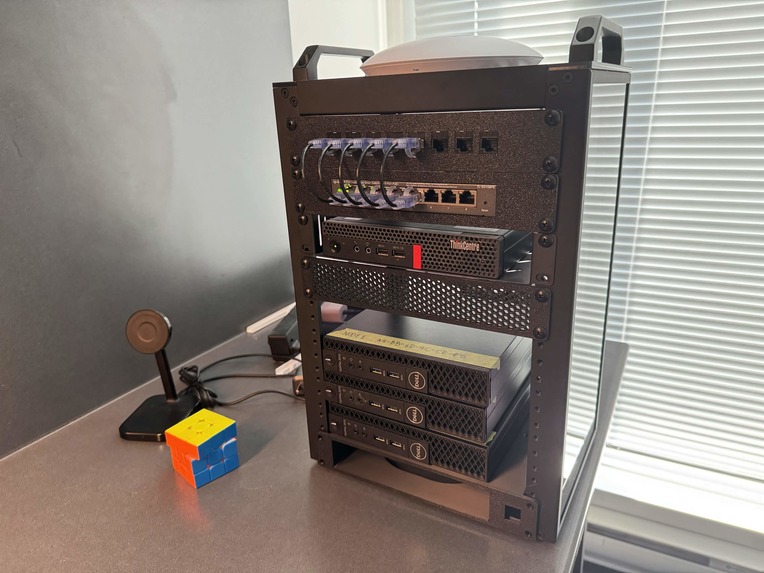
Our Kubernetes Cluster

PipeLie - Production-Grade URL Shortener
What it does
PipeLie is a URL shortener API that lets users create shortened links, track analytics events, and manage their URLs through a RESTful API with full OpenAPI/Swagger documentation.
Core features:
- URL Shortening -- Create short codes that redirect to original URLs, with collision-resistant code generation
- User Management -- Full CRUD for users, including bulk CSV import with batched database inserts
- Analytics Events -- Track creates, updates, and redirects with filterable event logging
- Caching -- Valkey (Redis-compatible) cache layer with automatic cache invalidation and
X-Cache: HIT/MISSresponse headers - Observability -- Prometheus metrics, Grafana dashboards, Loki log aggregation, and Alertmanager with Discord notifications
- Auto-generated API docs -- Swagger UI at
/apidocs/powered by flask-smorest and OpenAPI 3.0
How we built it
We started with the API endpoints, then layered production infrastructure on top. We installed Ubuntu on our physical servers, connected them into a private network using Tailscale (Tailnet), and set up a K3s Kubernetes cluster across all three nodes. The app runs behind nginx with multiple replicas. GitHub Actions handles automated testing on every PR, so broken code never reaches the cluster. Metrics flow to Prometheus, logs to Loki, and everything surfaces in Grafana.
Application Layer:
- Python 3.13 with Flask, Peewee ORM, and marshmallow for request/response validation
- Structured JSON logging via structlog + python-json-logger
- Custom Prometheus counters and gauges (URLs created, redirects, error rates, active/inactive URLs, short code collisions)
- Graceful cache fallback -- if Valkey is unavailable, the app continues serving from the database without errors
Database & Caching:
- PostgreSQL 18 with CloudNativePG operator in Kubernetes (3-instance HA cluster with streaming replication)
- Valkey replication cluster (1 master + 3 replicas + 3 sentinels) for caching with 30-second TTLs
- Connection pooling for database efficiency under load
Infrastructure:
- 3 physical Dell Optiplex servers running Ubuntu, connected via Tailscale (Tailnet) for secure remote access, setup, and monitoring
- Self-hosted K3s Kubernetes cluster across all three nodes
- Flask deployed as 3 replicas behind a Traefik ingress
- Full monitoring namespace: Prometheus (7-day retention), Grafana with provisioned dashboards, Loki + Promtail for log aggregation, Alertmanager with Discord webhook integration
- Alert rules for: service down, high error rate (>5% warning, >25% critical), high latency (p95 > 2s), high CPU/memory, and zero-traffic detection
CI/CD:
- GitHub Actions pipeline: tests run with PostgreSQL + Valkey service containers, enforcing 70% minimum code coverage
- Diff coverage checks on pull requests (80% threshold for changed lines)
- Automated deployment to K3s via GHCR container images on push to main
- Separate monitoring deployment workflow that auto-triggers after app deploys
Load Testing:
- Locust-based load tests simulating realistic user behavior with weighted task distributions
- Tested at Bronze (50 users), Silver (200 users), and Gold (500 users) tiers
Challenges we ran into
- Short code collisions -- With random 6-character codes, collisions are inevitable at scale. We implemented a retry loop with database savepoints and Prometheus collision counters to track the rate and ensure reliability.
- Multi-worker table creation -- Gunicorn spawns multiple workers, each trying to create database tables on startup. We handled this race condition with safe=True and exception handling.
- Kubernetes monitoring config management -- Keeping monitoring configs in sync between Docker Compose (local dev) and Kubernetes (production) was tricky. We established a single
monitoring/directory as the source of truth, with*.k8s.ymlvariants where needed.
Accomplishments that we're proud of
- A complete production stack running on physical hardware, not just cloud-managed services
- 8 distinct alert rules covering service health, performance, and resource utilization, all wired to Discord for instant notifications
- CI pipeline that enforces code quality with coverage thresholds and diff-coverage checks on every PR
- The caching layer gracefully degrades, the app never crashes if Valkey goes down
- 172 commits across 52+ pull requests, reflecting disciplined, incremental development
What we learned
- Observability is not optional -- Adding Prometheus metrics from the start made debugging performance issues orders of magnitude easier. Custom application metrics (not just HTTP status codes) were the real game-changer.
- Infrastructure as code pays dividends -- Having Kubernetes manifests, monitoring configs, and CI/CD pipelines version-controlled meant we could reproduce and iterate on our entire stack reliably.
- Load testing reveals architectural bottlenecks -- Running Locust at different user tiers exposed database connection pooling issues and cache contention we never would have found through unit tests alone.
What's next for PipeLie
- Authentication layer -- Add authentication to protect write endpoints, ensuring only authorized users can create, update, and delete URLs
- Offsite backup -- Implement automated offsite database backups to secure user data against hardware failure and physical attacks on the cluster nodes
- Rate limiting per user/IP to prevent abuse
- Custom short code aliases (vanity URLs)
- Click-through analytics dashboard with time-series visualizations
Built With
- alertmanager
- docker
- flask
- github
- githubactions
- grafana
- gunicorn
- k8s
- kubernetes
- locust
- loki
- peewee
- postgresql
- prometheus
- python
- tailscale
- uv
- valkey


Log in or sign up for Devpost to join the conversation.