-
-
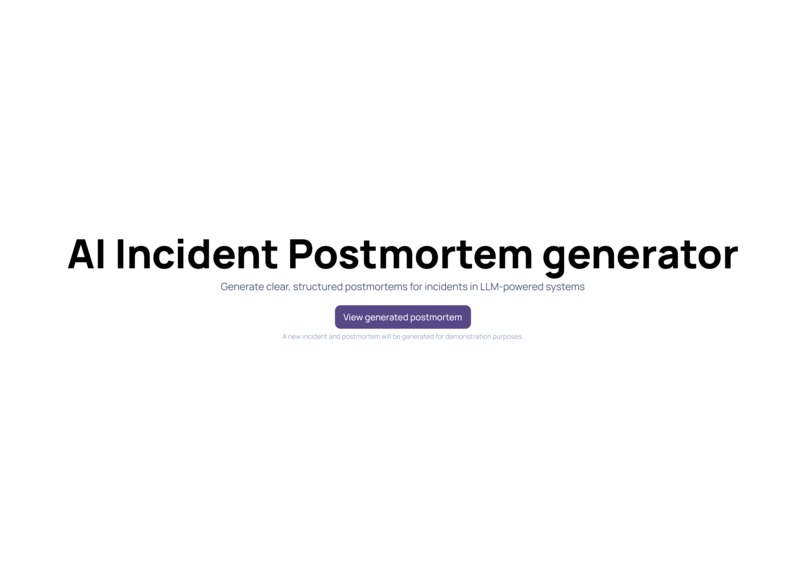
Landing page
-
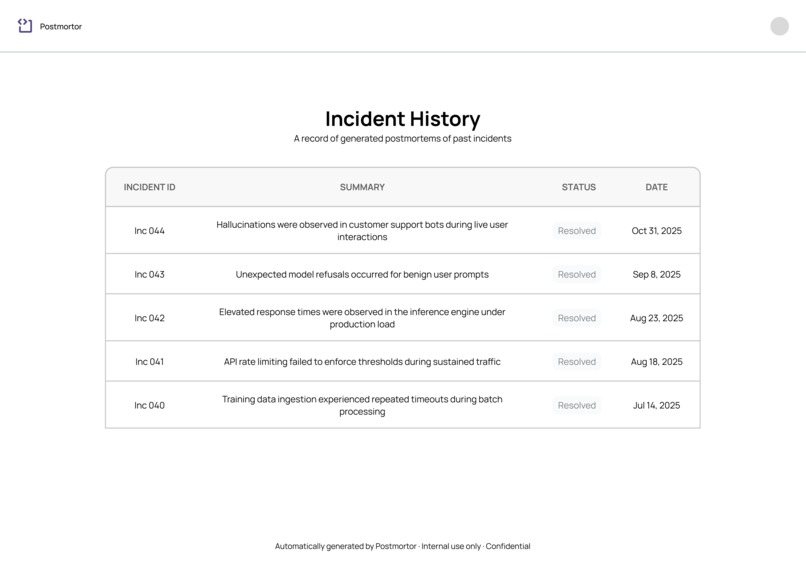
Incident History
-
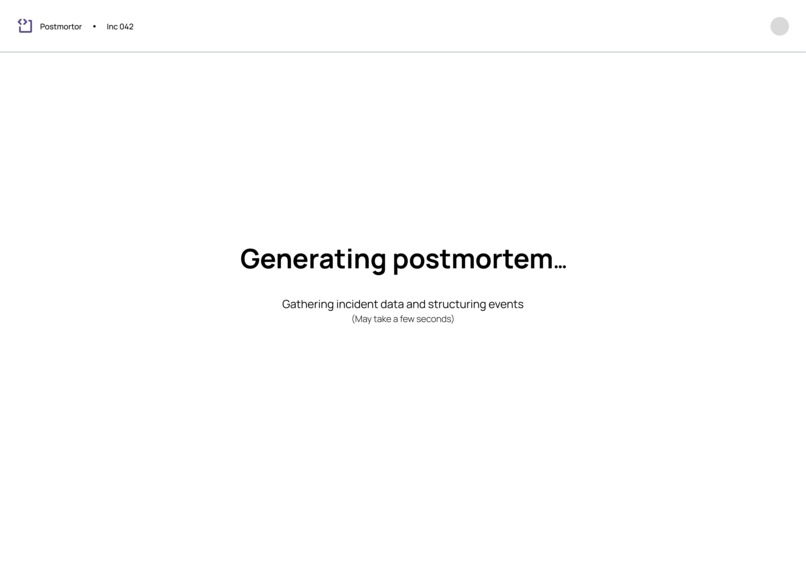
Loading screen
-
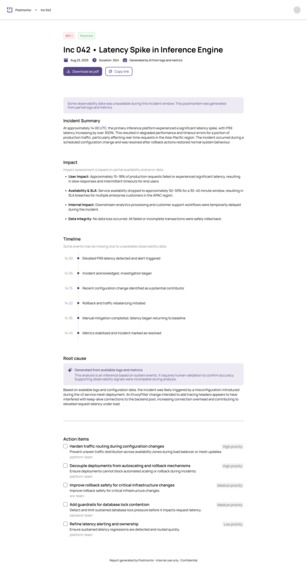
Postmortem report
-
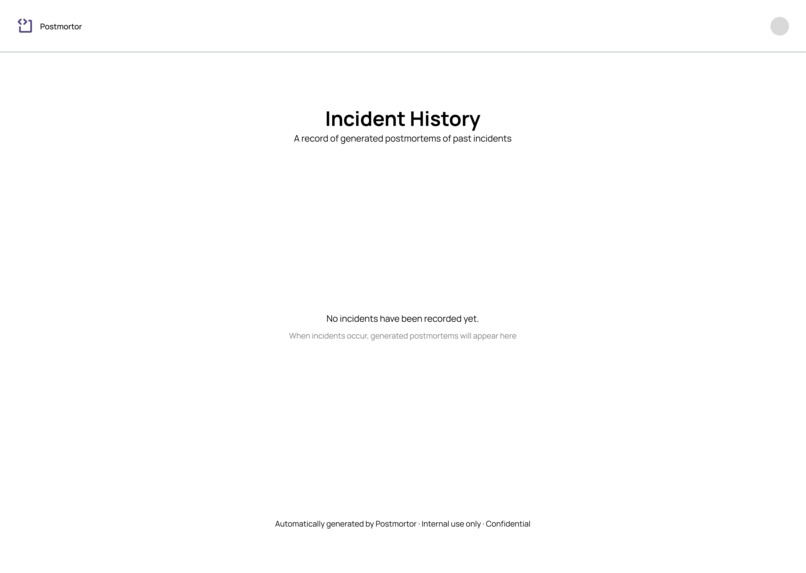
Empty screen - Incident History
-
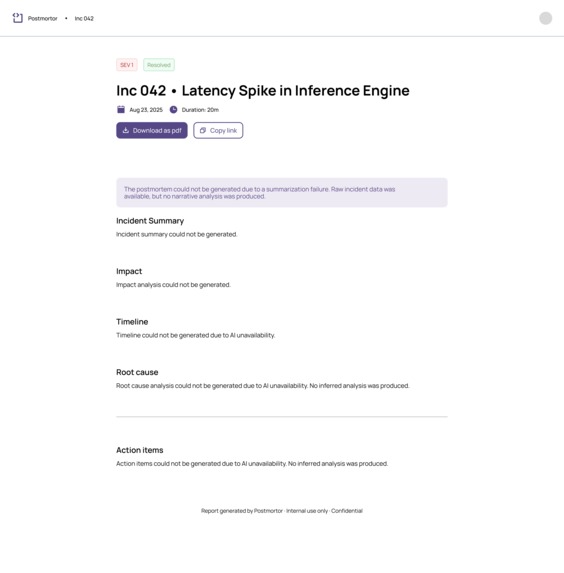
AI fallback state
-
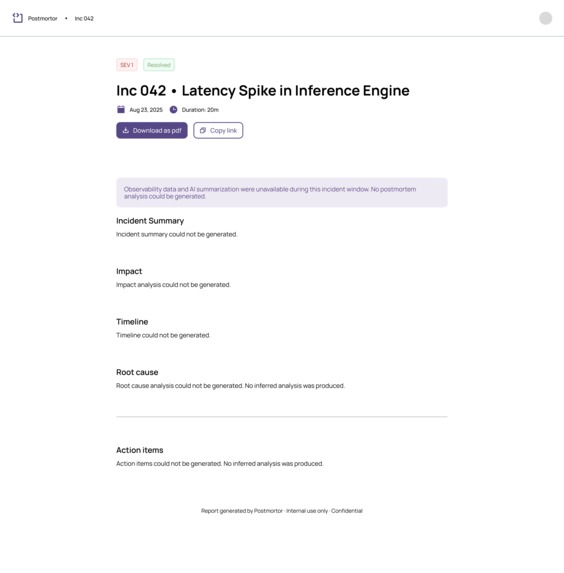
Fallback


Inspiration
It’s 3:00 AM. A critical LLM service in our demo app just spiked to 30-second latency, and the error rate is climbing. As students, we realized that while building AI apps is easier than ever, debugging them is a nightmare. Traditional monitoring tells you that a server is down, but it doesn't tell you why an LLM hallucinated, why tokens tripled overnight, or how an upstream provider's update broke your prompt logic. We wanted to build the tool we wished we had during the heat of an incident: a bridge between raw system metrics and human-readable accountability.
What it does
Postmortor is an AI-native Incident Postmortem Generator designed specifically for LLM-powered systems.
Real-time Detection: It monitors p99 latency, token usage, and error rates via a custom-built dashboard.
Automated Context Injection: When a "Generate" trigger is pulled, Postmortor scrapes logs from Datadog and internal traces to understand exactly what happened.
The Postmortem: It uses a fine-tuned analysis prompt to generate a structured, professional postmortem report—identifying root causes like "Inference Cluster Congestion" or "Token Overflow"—saving engineering teams hours of manual documentation.
How we built it
We built Postmorto using a modern, scalable stack:
Frontend: A sleek, responsive Next.js dashboard utilizing Tailwind CSS and Shadcn UI for a professional "command center" feel.
Observability: We integrated the Datadog API to ingest real-time logs and metrics from our simulated production environment.
Backend: A Next.js API route handles the ingestion and processing of event data.
AI Intelligence: We leveraged Google’s Gemini 2.0 Flash to process high volumes of log data and synthesize them into clear, actionable engineering reports.
Challenges we ran into
The biggest hurdle was Log Noise. LLM logs are incredibly verbose—thousands of lines of JSON describing every token and probability. We had to build a pre-processing "aggregator" to filter out the noise before sending it to Gemini, ensuring the AI focused on the anomalies (like the 300% latency spike) rather than the healthy requests.
We also battled "Hydration Errors" and complex Git merge conflicts while integrating our real-time KPI grids with the automated API triggers—a true hackathon rite of passage!
Accomplishments that we're proud of
We are incredibly proud of our Datadog pipeline. Seeing a simulated incident in our local app successfully transmit to a global monitoring suite, and then watching Postmorto turn those raw numbers into a "Reason for Failure" statement that actually made sense, felt like magic. We moved from "The system is slow" to "The system is slow because the inference cluster reached 95% capacity" in one click.
What we learned
We learned that Observability is a first-class citizen in AI. You can't just build a model; you have to build the "safety cage" around it. We also leveled up our skills in Next.js Server Actions, handling asynchronous log streams, and the nuances of prompt engineering for technical documentation.
What's next for Postmortor
Postmortor isn't just a hackathon project; it's a foundation.
Predictive Alerts: Moving from generating postmortems to preventing them using anomaly detection.
Slack Integration: Automatically dropping the generated postmortem into a dev channel the moment an incident is resolved.
Multi-Model Support: Comparing performance across GPT-4, Gemini, and Claude to see which model handles specific incident types best.
Postmortor: Because every incident is an opportunity to learn, if you have the right data.
Built With
- datadog
- next.js
- typescript
- vercel

Log in or sign up for Devpost to join the conversation.