-
Protogress Logo
-
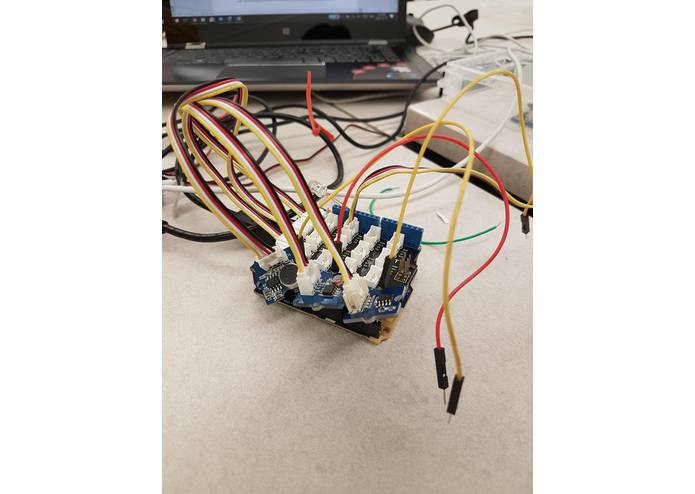
Protogress Arduino Sensor
-
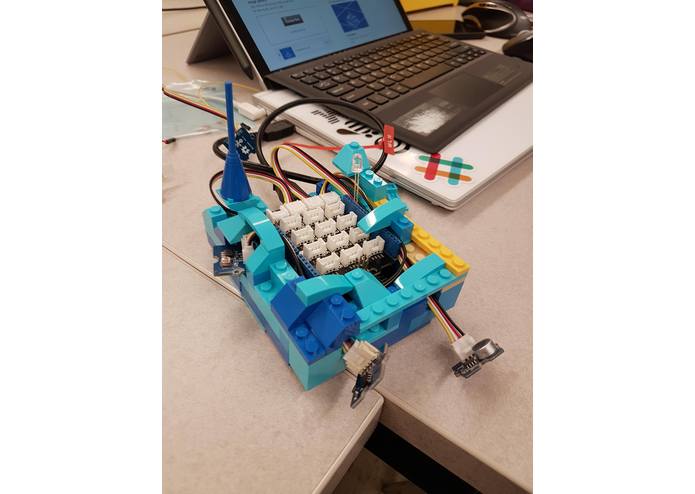
Final Arduino Sensor
-
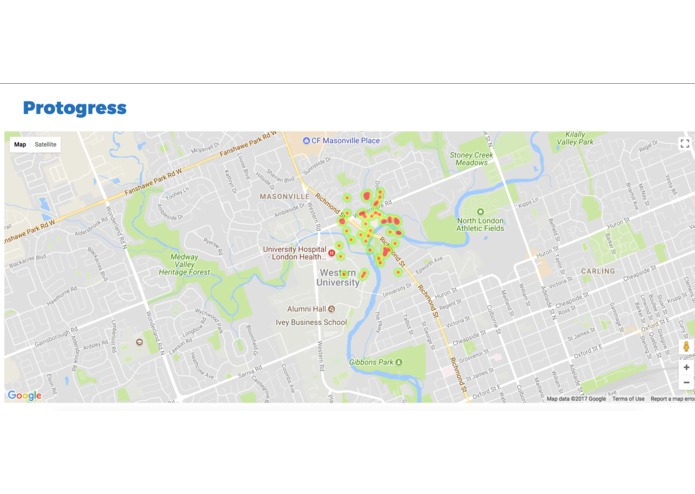
Protogress Heatmap


Inspiration
Protogress has been developed to improve the urban planning process. As cities expand, urban planners and engineers need to have accurate data on the areas to be developed or redeveloped. To assist urban planners, Protogress is available to gather various information such as noise pollution, light intensity, and temperature to provide a better picture of the area. With its modular IoT design, it has the ability to provide low-cost preliminary surveys.
What it does
Protogress utilizes two Arduino 101’s to realize an IoT network through various sensors to gather data on noise, light, human movement, and temperature throughout areas as small as individual homes to large areas like entire cities. The Arduinos form a network by communicating via Bluetooth Low Energy Technology. Through this network, Protogress is able to record and transmit data from our physical sensor network to the database to be displayed on a Google Maps interface.
How It's Built
Frontend The front end of the website was developed using MEAN stack to create intensity zones through a Google Maps API. It extracts the data from the Protogress Database gathered through one of our peripheral devices and uses the data on Google maps.
Backend The Protogress Database uses MongoDB to store the data obtained the physical sensor network. The Central Arduino requests information from the peripheral devices, and documents the information in a Python script. In this script, the data is quantized into a value that is sensible to humans and than sent to be stored in the Protogress Database.
Peripherals The Protogress IoT Network uses the Arduino 101 board to record data from its sensors and store onto our database. In our demo network, there are two Arduinos, the Sensor and Central. The Sensor will acquire constant analog signals from the sensors and is connected to the network through the built in Bluetooth Low Energy system on the Arduino. Central is connected to the internet through serial communication and a laptop. It can be set to gather information from the nearby Sensor as frequently as needed, however it is currently set request every ten seconds to minimize power consumption. Upon receiving data from the Sensor, it is recorded by a Python script to be uploaded to our database.
Challenges
We faced several challenges when developing Protogress; Integration of google maps API with Angular, the quantiation of the sensors, and the Bluetooth communication of the Arduino.
Accomplishments
Our greatest accomplishments were the successful quantization of sensor data, transmission of sensor data through Bluetooth Low Energy and our implementation of Google Maps API to display our data.
What Was learned
We learned about Mean Stack development and how to incoporate it with the local host and the quantization issues with Arduino Groove kits.
What's next for Protogress
Protogress can be modified for a variety of services, our next steps include adjustments of different sensors, creating a larger network with more devices, and developing a network that can be displayed real-time. Some applications include furthering the range of capabilities such as an pollution detector, and the possibility of permanent systems integrated with city infrastructures. This system demonstrates proof of concept and we envision Protogress to be realized with even lower cost microcontrollers and packaged in a sleek modular design. With the addition of an air quality sensor Protogress can be used to monitor pollution emitted from heavy industrial zones. Protogress can also be used as a natural disaster sensor system with a vibration sensor or a rain sensor. With these sensors the Protogress can be placed on buildings or other structures to detect vibrations within buildings using vibration sensors or even sway of buildings. Ideally, Protogress will continue to be improved as a device made to assist in providing safety and allowing efficient development of entire communities.


Log in or sign up for Devpost to join the conversation.