-
-
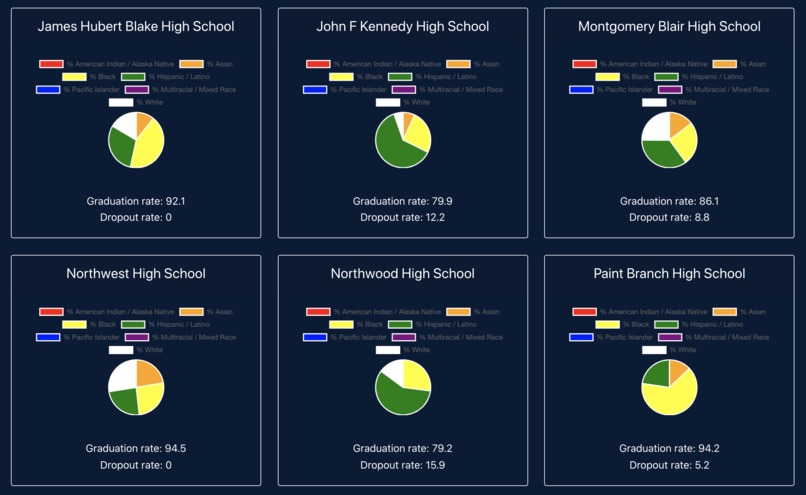
Pie charts made using Chart.js displaying the racial demographics of various schools
-
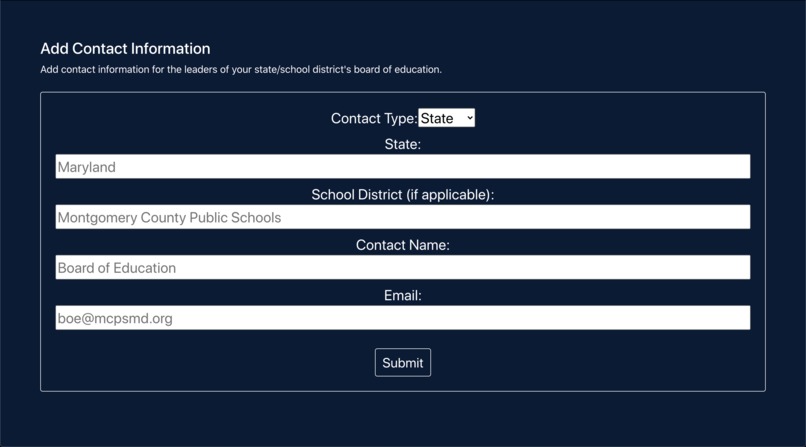
Users can also add contact information for school board leaders of different states and districts
-
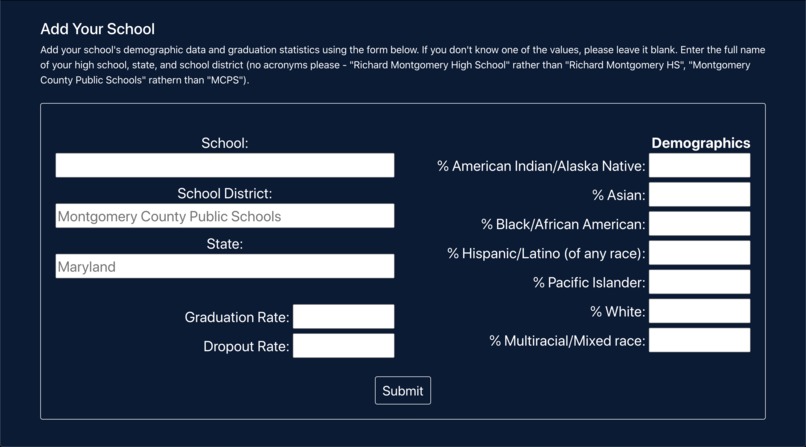
If the user's school is not in the database, they can add the statistics themselves
-
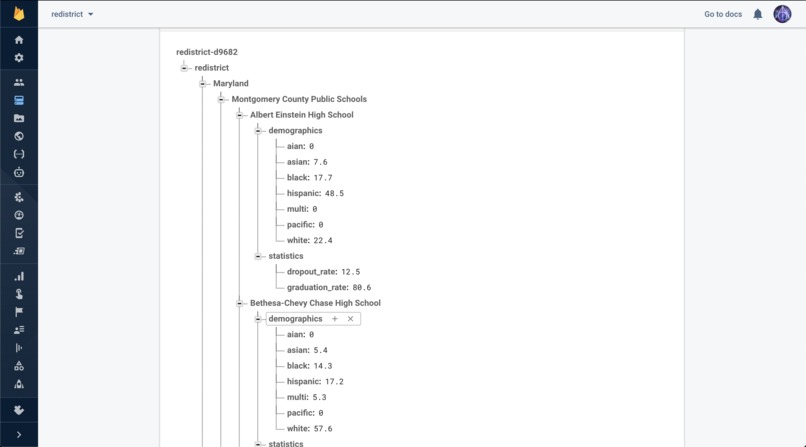
The contact information and school statistics are uploaded into a Firebase realtime database
-
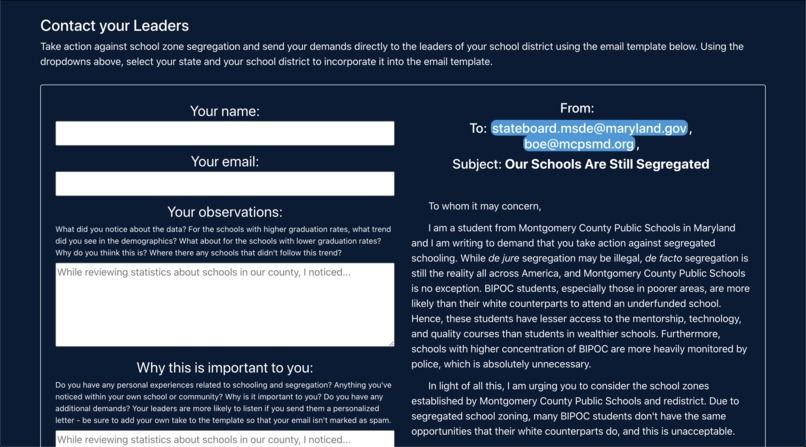
The user can enter in information and observations they made while looking at the data to compose a letter to leaders


Inspiration
I live in an area bustling with immigrants and people of color, so our schools should be pretty diverse... right? While my school district is overall a minority-majority district, with only about a quarter of our students being white, many schools in my area still struggle with de-facto segregation as a result of segregated school zones. What this means is that some school zones are set up to encompass more wealthy neighborhoods whereas others are set up to encompass poorer neighborhoods, and because public schools are paid for using tax money collected from the area, schools in poorer areas have less funding. Combine this with housing segregation and we get the unfortunate reality that many BIPOC attend underfunded schools.
What it does
To raise awareness of this issue and to encourage students to take action, I created RedistrictMe, a crowdsourced web application that displays demographic data and graduation statistics of various public schools and generates an email template for students to petition the leaders of their school board.
How I built it
I built this app using the JavaScript framework React.js to design and display the components. I used Google Firebase's Realtime Database to save school statistics entered by the user and to retrieve school data to display to the user. I used the API Chart.js to display the pie charts. Finally, I used Bootstrap to help style the CSS elements. I deployed the website on GitHub pages.
Challenges I ran into
I joined the hackathon late and didn't actually start building my app until the morning of the second day. Since I've never used React.js before, and I was working solo for the entire project, the biggest struggle was finishing all of the features in time. It took a while to figure out how to display the data retrieved from Firebase, as the data was received asynchronously and I couldn't figure out how to integrate this into the rest of the program.
Accomplishments that I'm proud of
-Building a React.js app from scratch without having any prior experience or knowledge about it
-Integrating forms and charts into React components
-Automatically refreshing the React components when I got new data
-Integrating Chart.js, an API I've never used before, into a framework I hardly knew how to use
-Having a relatively smoothly-loading UI whereas the last time I used Firebase, all of my data loaded very slowly
-Doing all of this completely on my own
-Basically, supremely pushing my comfort zone in a short period of time and not completely giving up haha
What I learned
-The basic concepts of React.js—props, components, states, rendering, etc.
-How to integrate Firebase into React.js and load Firebase data into a React component
-How to handle forms in a React.js component
-Rendering an array of data into a React.js component using mapping
-Conditional rendering in React
-How to use Chart.js
-That taking breaks (especially if you're working alone on a very strenuous project) is super helpful
-That my county's school zones are pretty darn segregated despite being a minority-majority school district
What's next for RedistrictMe
-Integrating a Maps API to further hammer in the point that school zones are unnecessarily segregated
-Adding some method of verification so that the user can't add completely faulty data to the database
-Adding additional data about policing, test scores, and accelerated classes
-Making the UI more aesthetically pleasing, putting each component on a separate page
-Making the UI more mobile-friendly, displaying the pie charts more clearly
-Allowing the user to email their school board directly from the website


Log in or sign up for Devpost to join the conversation.