-
-
Main Page
-

loading
-
-
-
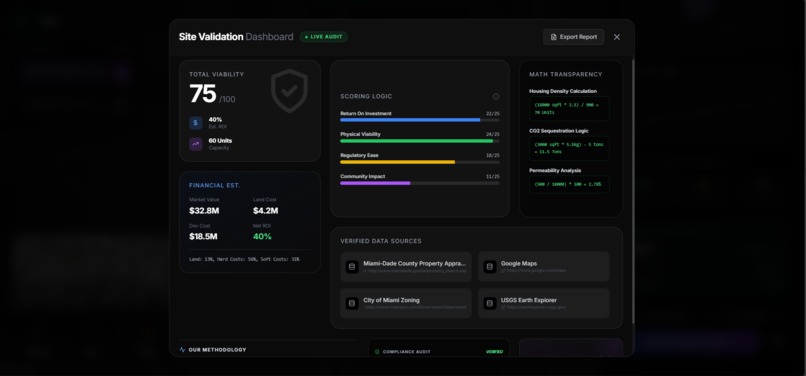
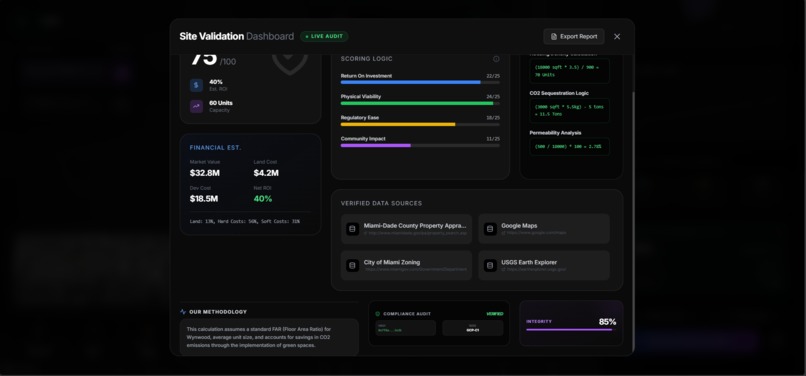
Validation Page
-
-

-


Inspiration
Urban sprawl is one of the greatest silent contributors to the climate crisis. Every year, millions of acres of forest and wetlands are bulldozed to build low-density suburbs, forcing residents into car dependent lifestyles that skyrocket carbon emissions. Meanwhile our cities have abandoned parking lots, malls, and single story concrete strips that trap heat, increase flood risk, and stifle biodiversity.
Last semester, we came across the idea of infill development. This refers to redeveloping land in urban areas that are misused or run-down. A single parking lot in a high-density residential zone could easily provide 75 housing units. Compared with suburban sprawl, infill development can make use of existing public services like public transportation, health, fire department, and police. Additionally, zoning laws already exist to allow for residential building. Because of this, infill could be a solution to the urban sprawl, the unnecessary expansion through forest destruction, and the unused lands.
In addition, living in more developed, denser areas can help lower our carbon footprint. When homes are located closer to grocery stores, schools, and workplaces, people are more able to walk or bike as part of their daily routines. Compared to endless urban sprawl, compact urban living also allows for more efficient use of public resources such as buses and metro systems, along with shared infrastructure like power, water, and sewage systems.
Looking forward, infill development is one of the many possibilities for the future of American city planning, a true alternative to suburban sprawl. Infill doesn't just provide housing units and solve this urban sprawl issue; it can play its role in saving our planet with a more sustainable living.
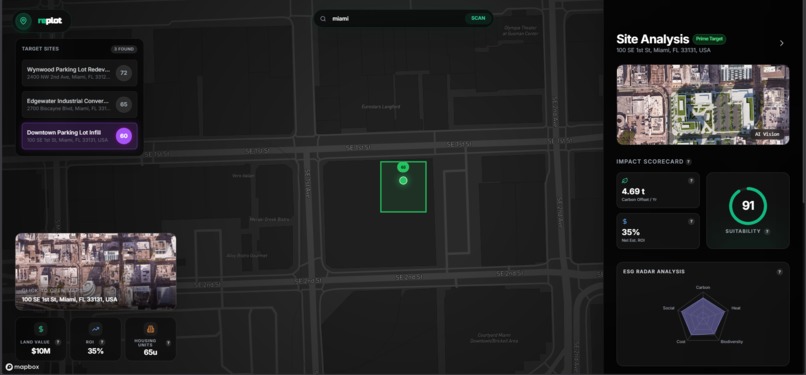
What it does
RePlot is an interactive tool used to identify opportunities for infill development throughout the country. When given a city/area, we look for parcels of land that are viable for infill. RePlot looks for plots of abandoned/run-down parking lots, as well as failing single-story commercial and residential buildings. We use Google Gemini to analyze and grade each piece of land on four factors: ROI, Physical Traits, Regulation, and Impact. Here is how each part is broken down into:
ROI(Return on Investment) -- 25 points:
- Cost of Land
- Cost of Development
- Value after Development
- Original Value of Parcel (All factors within ROI sum to 25 points)
Physical Traits -- 25 points:
- Size of Parcel -- 10 points
- Shape of Parcel -- 10 points
- Infrastructure and Risk of Natural Disasters -- 5 points
Regulations -- 25 points:
- Viability for Special Development Plan -- 15 points
- Parcel Zoning Laws -- 10 points
Impact -- 25 points:
- Housing Units Provided -- 10 points
- Local Housing Shortage -- 10 points
- Local Culture and Heritage Lost -- 5 points
The generative AI actively avoids suggesting parcels with schools/universities/research institutes, hospitals, police and fire departments, parks, sports facilities, hotels, and other public amenities. These four factors sum to 100 using a special algorithm we developed that uses all the given data to rank the parcels in a certain area, looking into environmental ROI, feasibility, socio-economic and environmental impact, yield potential, and more. We pick the parcels with the best scores and present them to the user.
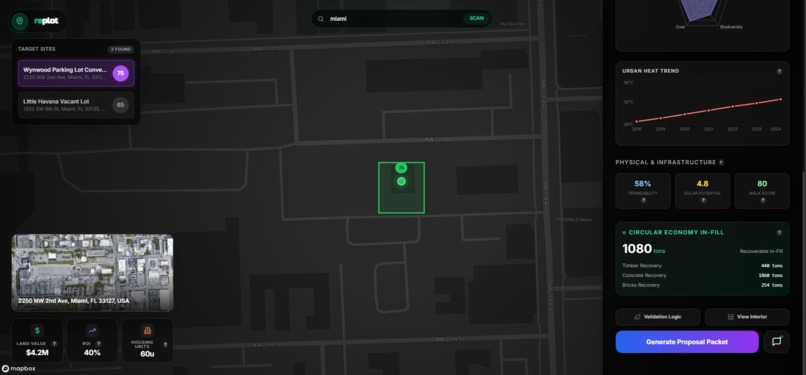
We also use Google Gemini to help with finding data for sustainability metrics. RePlot will present these metrics to the user, which informs them more about their impact on the environment.
How we built it
We programmed RePlot using Python and FAST API for the backend, and JavaScript, HTML, CSS, and React for the frontend. We used Google Gemini through OpenRouter as our main source of generative AI.
To make this, we started with making a simple program using Google Gemini to give candidate locations for infill development. From there, we added a frontend, which includes an interactive map and a landing page. We then spent time improving the accuracy of Gemini's suggestions as well as focusing on more sustainability indexes. We consider the environmental impacts from factors including IPCC Carbon Accounting Standards, Stanford InVEST Cooling Index, the UK's Biodiversity Metric, ERA Stormwater Management formula, and more. From there, we added more and more functionality, improved response time, and bug fixed until we were satisfied with the project.
Challenges we ran into
- The accuracy of the map was one of the biggest problems we faced. Despite being able to find all the information required and getting proper locations, the translation of the actual location to the real map in coordinates was one of the hardest parts. We used to get an offset and had to do a lot of fine-tuning to fix it.
- The behavior of the project on all our computers was another setback. Because of the sheer scale of our project, we had a lot of conflicts between each of the features and needed to find ways to resolve them without sacrificing functionality. We were able to fix this with proper version control and constant git use.
- Despite our app using a lot of sources to pull data, a big challenge and important thing to keep in mind is the validation of the data. We took validation to be a big part of our project and hence spent a large amount of time working on getting the results to be correct, hence we decided to add a validation page to show what is really happening behind all the numbers and where we are even getting all the information from.
Accomplishments that we're proud of
We were able to achieve almost all the core functionalities that we initially planned to have in our program. We also managed to use many APIs, most of which were completely new to some of us. We also referenced real-world data, which was something we hadn't done before, and used it for our economic and environmental analysis.
What we learned
We did research into sustainability and learned a lot about things to consider when deciding how sustainable a piece of underutilized land is, how different laws affect it, and how we should not only fetch data, but also validate it. We also learned how we can perform algorithms to make even more sense from this data, based on the different categories we looked into, to make an accurate number for the sustainability of land. We got to use different map APIs to develop our web application while also figuring out how to fetch the data we need to analyze and give accurate results that cross-check with other sources. Throughout the project, we also learned a lot about using git and a lot of features git offered that we were able to try out.
What's next for RePlot
Immediate Steps It would be amazing if we could build a memory and a database for this project. In the current scenario, we are prompting Google Gemini every time a user inputs a location. If we have a short-term memory, we can allow the user to more quickly return to their previous query, in case of a misclick. In addition, building a larger database could be helpful for improving the speed of delivering candidate parcels.
Also, we need to modularize the building generation tool. We need to help it identify individual elements like parked cars, trees, roofs, as well as walls, which should help with the building generation accuracy.
Built With
- css3
- fast-api
- flux.2-api
- google-gemini
- google-maps
- html5
- javascript
- mapbox
- node.js
- openrouter
- python
- react
- uvnicorn


Log in or sign up for Devpost to join the conversation.