-
Welcome screen
-
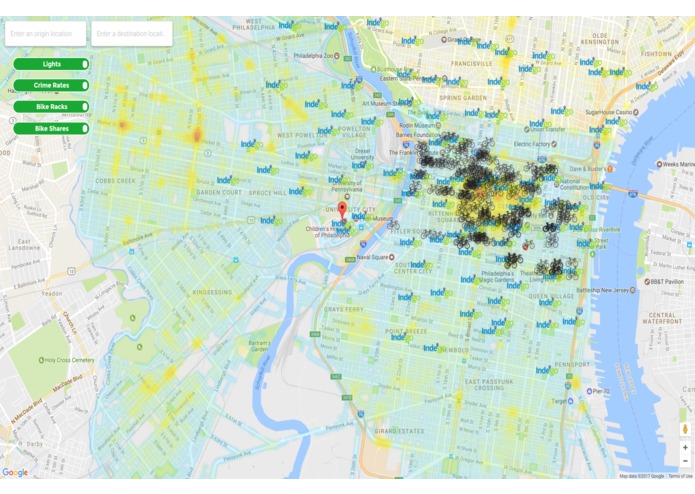
Overall view showing light, crime, bike rack, and bike sharing center data
-
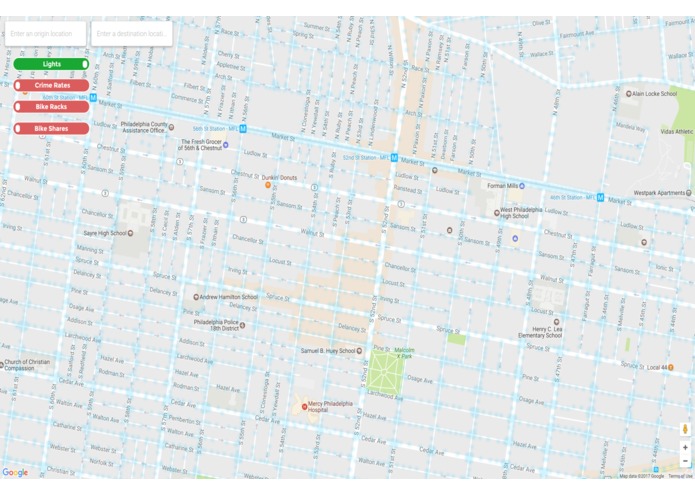
Close-up of street light data details
-
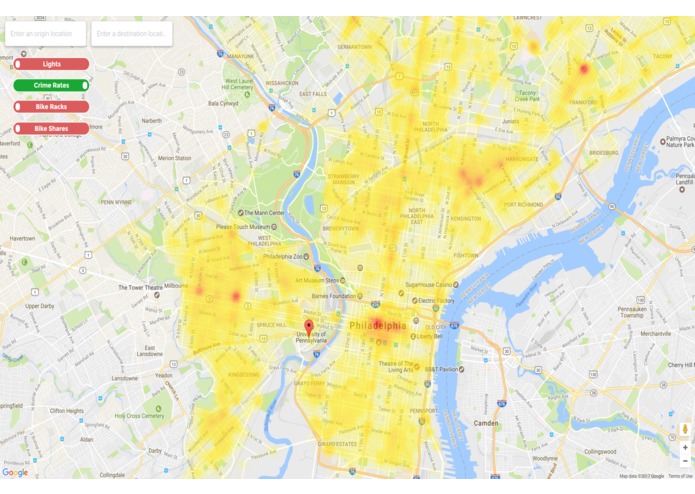
Overview of the crime data. The gradient goes from yellow (less crimes) to red (more crimes)
-
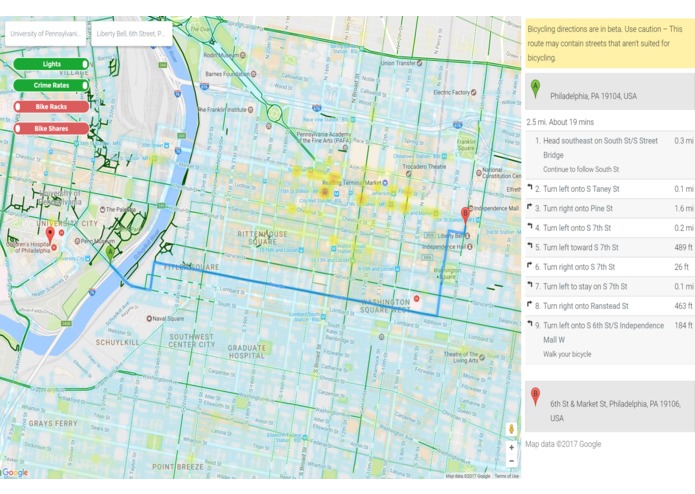
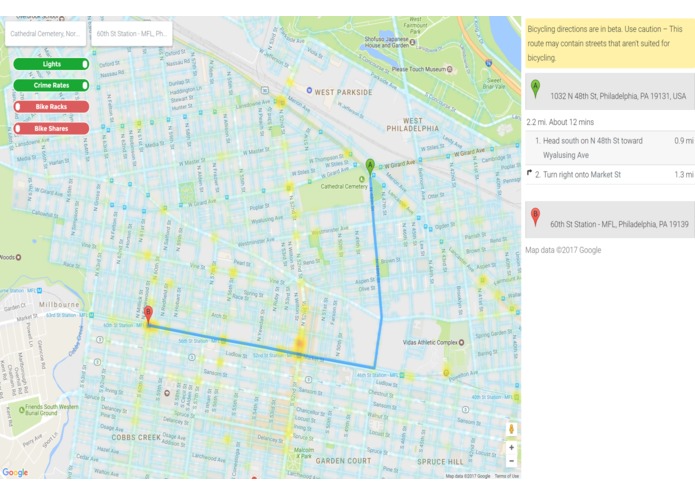
Example of how the heatmaps for crime and light data overlay over navigation
-
Example of a path that goes through an area of high crime frequency
-
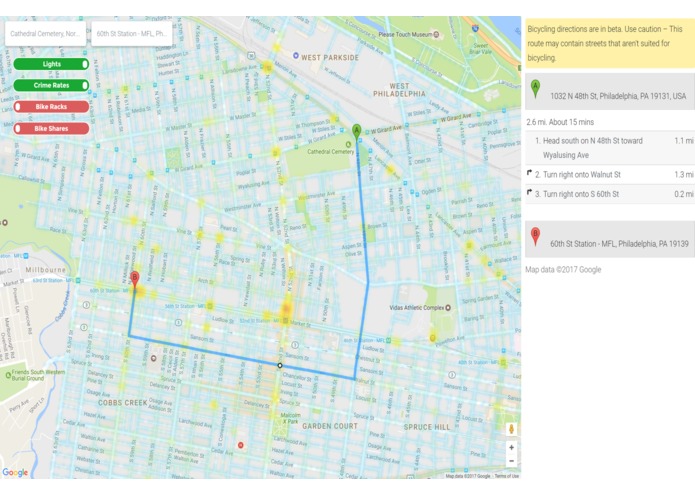
Draggable paths allow users to make paths that are safer to travel
-

Information about bike racks and bike sharing centers provide ways to get around town


Inspiration
We created Velocity because we believe that ensuring safer, more secure bike rides contributes towards promoting societal well-being and happiness. Biking is a mode of transportation that is common to people of all socioeconomic and cultural backgrounds, and is simply a common-sense, clean, and easy way to get around the city (and get exercise)! However, biking can be a risky mode of transportation at times, and we wanted to bikers to feel as safe and secure as possible. After looking at data available from OpenDataPhilly (a part of the Open Government Initiative), we were inspired by how much useful data was out there and decided to aggregate it together and present it in a way that was intuitive yet extremely useful for the everyday citizen.
What it does
Velocity is a web app that allows bikers to easily find routes to and from locations across Philadelphia with easy-to-understand heatmap layers depicting crime rates and street lighting across city blocks. Additionally, Velocity also provides clear and visible markers for bike racks and bike share locations in order to help make sprawling, multi-stop trips across the city easy and safe to map out. Routes can be dragged and modified as one wishes, so that anything from stopping at a burger joint to embarking on a trip to visit every major park in Philly is possible. You can either follow the route along the map, or read the written directions shown on the sidebar.
How we built it
We started first at OpenSourcePhilly, a treasure trove for civic hackers boasting a catalog of open data concerning the Philadelphia region (and is a part of the Open Government Initiative). We used data on crime incidents, street lighting, bike share locations, and bike racks that were available (in .csv and .json format) and parsed those data sets for locations and other fields, which we then formatted and integrated into Google Maps. We then went further and weighted certain entries more than others based on the nature of the crime. For example, crime incidents that seemed less relevant to a biker’s interests (such as embezzlement) had lower weights and more dangerous and salient threats (such as assault with a firearm) were assigned larger weights.
We wrote scripts in Python in order to quickly accomplish this task, and then wrote JavaScript code to import these into our web app’s framework. Our web app was created using HTML, CSS, JavaScript, jQuery, and Flask, as well as the Google Maps API for maps, directions, routing, markers, and heatmap layers.
Challenges we ran into
Our biggest challenge was in parsing the data. Not only did the various data sets we used vary in format (from .csv files to .json files) or were contained several missing fields, the main challenge came in the sheer size of the files. For crime incidents, the data set contained close to two million entries with information about crimes committed in Philadelphia for over ten years. We had to pay attention to how efficiently we processed the data because of how long queries would take, and also what information was important to include (and what wasn’t) since some operations would take quite a few minutes on our machines to run. For example, we decided that including just one year’s worth of data was satisfactory enough for giving an accurate representation of areas in Philadelphia with higher crime rates.
We also found that combining different elements in Google Maps was difficult in order to maintain an image that is easy to understand. We decided that using heatmap layers was the most efficient way to display high crime areas and street lighting, however we had to tweak the balance of saturation and gradient colors frequently in order to maintain the map’s integrity. Additionally, we ran into issues of calling a function before the API had fully loaded when using the geolocation and autocomplete directions and search features together, which was caused by the asynchronous nature of JavaScript execution.
Accomplishments that we're proud of
In the end, we are very happy with how our map turned out, as we were able to efficiently process data, and seamlessly integrate the Google Maps API into our web app. We felt that we were able to take an overwhelming, massive amount of data, and create something that is manageable, simple, and easy to use. We are also proud of how viable and useful our final product is for use in everyday life, as the quantity and accessibility of data offered by our app gives people the ability to make more well-informed and safer choices about their biking trips.
What we learned
This was our first try at anything related to social and civic hacking, and we learned a lot about the sheer quantity of public data available that is free for us to use for discovering problems and creating projects. We also learned a lot experimenting in-depth with the Google Maps API, and this was the first time we used the API, and worked with heatmap layers to the scale that we did with this project. We also gained a lot of experience in working with extremely large data sets, since we had to write Python scripts to parse and extract what we needed.
We also learned that if you accidentally swap the latitude and longitude coordinates for virtually any place in Philadelphia, you will, in fact, end up in Antarctica. We learned this from experience when we couldn’t find several data points we had entered… until we zoomed out. :)
What's next for Velocity
Currently the service is provided only in web form and can be accessed from both desktop and mobile devices. However, a specialized mobile app (especially for on-the-go routing) would make the app much more accessible and convenient to use in everyday biking situations. We also depend mostly on the user to judge the risks and benefits of a particular path, so in the future we would like to build an algorithm that generates safe paths for the user, in addition to visually guiding them. We also feel like we could use the our data sets more effectively by introducing new variables. For example, if we considered time, we would like to change the heat maps based on the time of day, since crimes occur at a significantly higher rate at night than during the day and street lights are not too important during the day, or on special days such as Thanksgiving or New Year’s Eve when crime rates usually spike.
Built With
The datasets were from OpenDataPhilly (part of the Open Government Project) and processed using Python. The Google Maps API provided most of the mapping capabilities. The home page is a modified HTML/CSS/JavaScript template from Templated. The web server was written in Python using Flask.


Log in or sign up for Devpost to join the conversation.