-
-
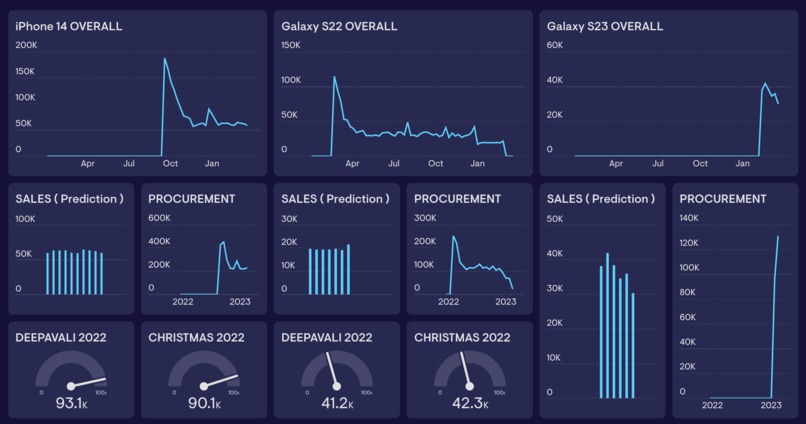
Dashboard
-
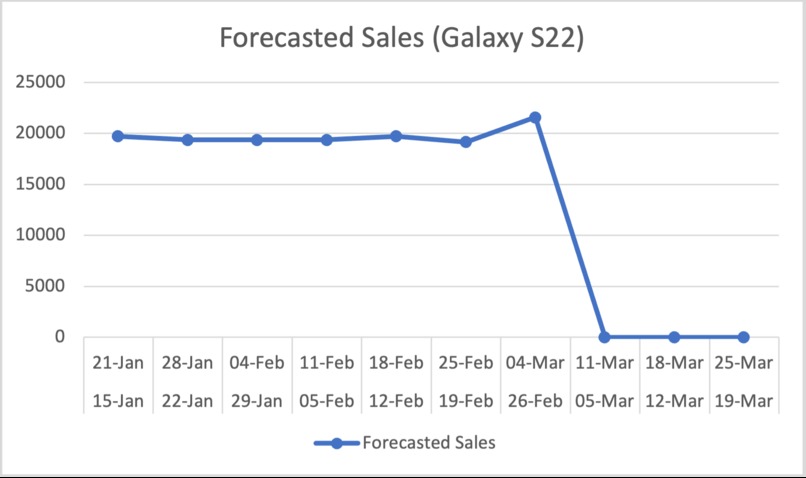
Forecast for Galaxy S22
-
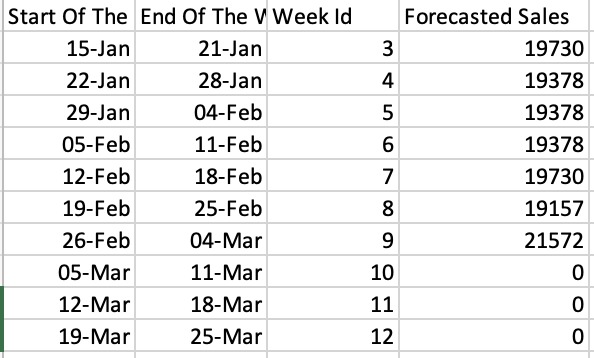
Forecast for Galaxy S22
-
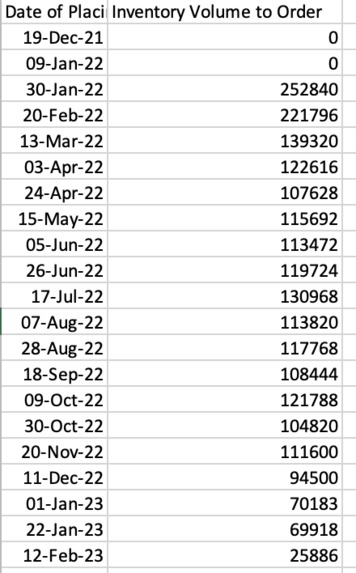
Procurement ( S22 )
-
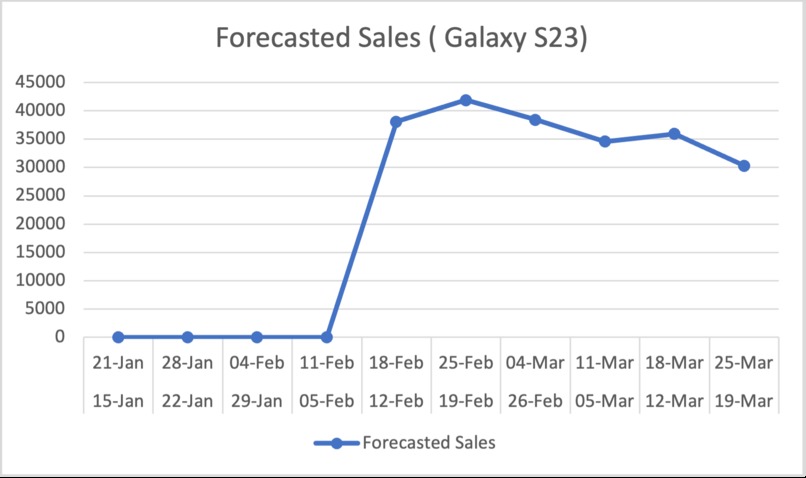
Forecast for Galaxy S23
-
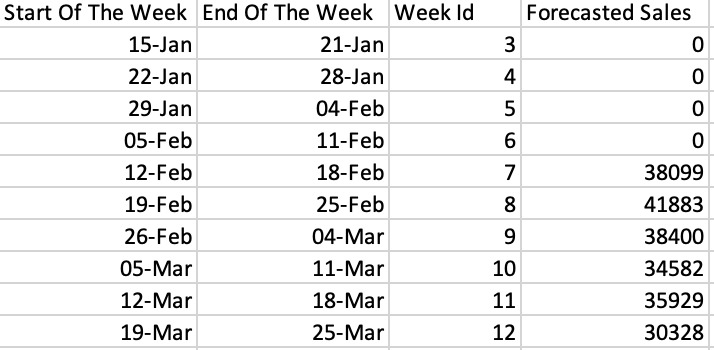
Forecast for Galaxy S23
-
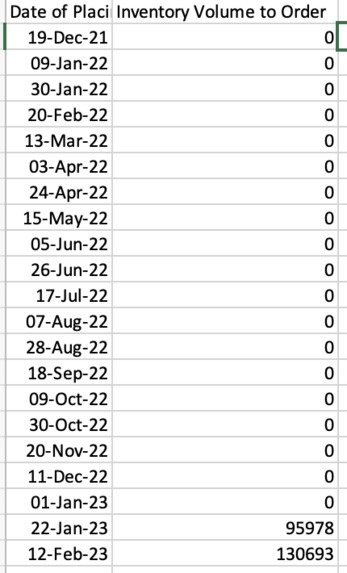
Procurement ( S23 )
-
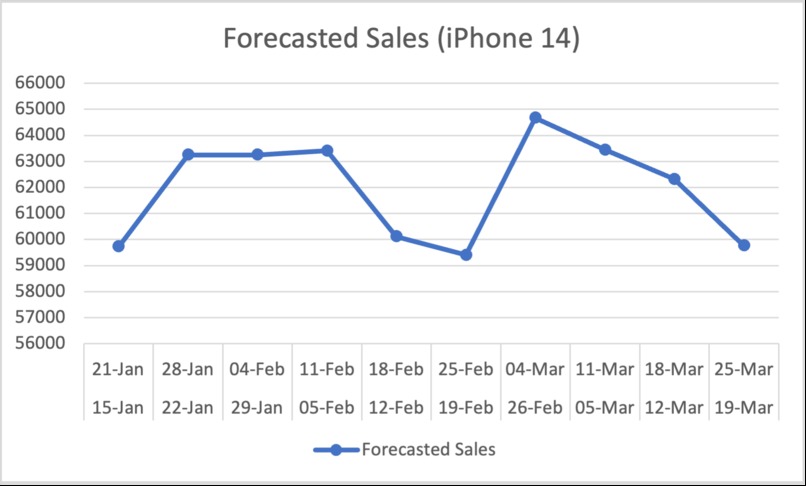
Forecast for iPhone 14
-
Forecast for iPhone 14
-
Procurement ( iPhone 14 )


Team - Mohor Banerjee, Ananya Agarwal, Rudra Prasadh Ganesh, Aryan Gupta
Inspiration
Our motivation to apply our machine learning skills in a real world scenario is what inspired us to work on this project.
How we built it and What it does
Our project attempts to take into account the psychology that lies in the cellphone market. Subtle things such as the launch of iPhone 15 in late September 2023 has the potential to dissuade an apple fanatic from the purchase of a Galaxy S23 in February 2023 even if his current iPhone is malfunctioning.
Our model was made using the Orange Data Mining Software using a Gradient Boosting model. The model selection was done such that it produced the least errors among the models tested.
The independent variables used are as follows:
1)Number of weeks until EOL of iPhone 13, Galaxy S21 and Galaxy S22 2)Number of days until launch of iPhone 14, Galaxy S22, Galaxy S23 and iPhone 15 3)Number of days Samsung and Apple give offers 4)Offer amount 5)Number of holidays per week 6)Sales of similar devices by the same company
Above are the various ‘feature’ attributes. There are two meta attributes - Start date of the week and week ID.
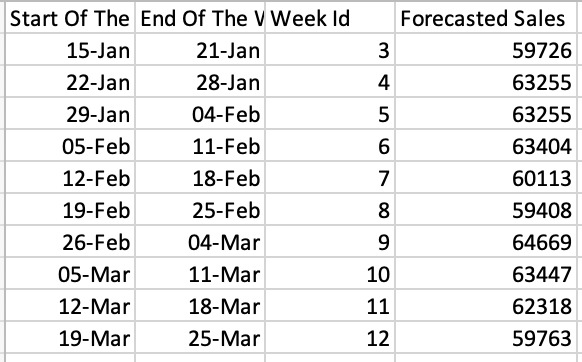
We have used these variables to forecast sales for the following 10 weeks starting on 15 January 2023. Note that the model also takes into account the festive season which usually results in a shopping spree, increasing sales. This was accomplished by categorizing days as "special holiday days" from one month before the actual holiday.
In the dashboard we have plotted the overall sales data for iPhone 14, Galaxy S22 and Galaxy S23 to show the various sales trends over time.
The Sales widget highlights our prediction for the next ten weeks of the sales, for the sales team to take relevant decisions according to the data provided. After the forecasted 7 weeks, S22 will reach its End Of Life(EOL) and would therefore go off-shelf, so we have only modelled for the following seven weeks. S23 will be released during the 5th week, so we have modelled the sales from then.
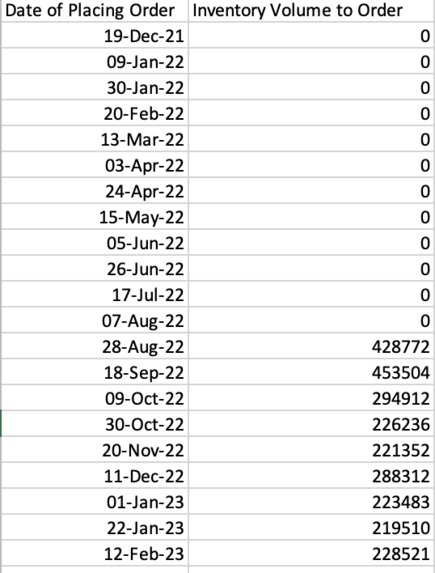
For Procurement, we have taken into account the lead time of the supplier as two weeks (our assumption) and we have assumed that the company will keep stocks for 3 weeks of products. We have also kept a a buffer of 20% in case of sudden sales jump, supply disruption etc.
In the Festivals Widgets, we have highlighted the number of sales of the phones during the Christmas and Deepavali sales, which have brought about the highest sale rate, for the sales team to consider when ordering their products. Since Galaxy S23 will just be launched, we could not model the data for its sales during the festivals.
Challenges we ran into
We could not reduce the duration of the video to 1-2 minutes. However, we tried and made the best in-depth video possible focussing on all the details. It was a challenge organizing the data and then deciding the independent variables was also very time consuming, considering that they had a major impact on final forecasts. Deciding the types of graphs and plots for the dashboard was also a tough decision as different graphs convey different meanings are better in some way than the other in conveying details.
Accomplishments we are proud of
We could successfully forecast the data for the next ten weeks of sales starting from 15th January in a very limited time.
What we learned
We learned a lot more about Data and Business Analysis and also, Machine learning.
Built With
- excel
- geckoboard
- orange-data-mining


Log in or sign up for Devpost to join the conversation.