-
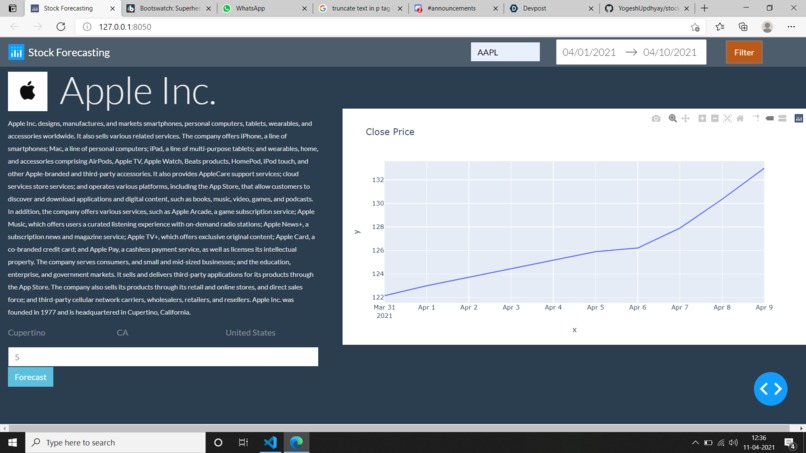
UI

Inspiration
Beginners usually struggle understanding the basics of investment in stock market. Stock Visualizer is a user friendly application that focuses on providing beginner friendly insights to its users.
What it does
- It fetches live market data for the stock..
- Displays user friendly graphs for better understanding market trends.
How I built it
- Designed a UI interface using Dash.
- Next step was fetching stock data using yfinance.
- Finally base on the data graphs were rendered to the UI using plotly.
Accomplishments that we're proud of
- The application renders user friendly graphs providing beginner friendly stcok market data.
What I learned
- Build dashboards using Dash and Plotly.
What's next for Stock Visualizer
- Addition of stock forecasting machine learning models.
- Various indicator graphs.

Log in or sign up for Devpost to join the conversation.