-
-
-
Super Ciruits
-
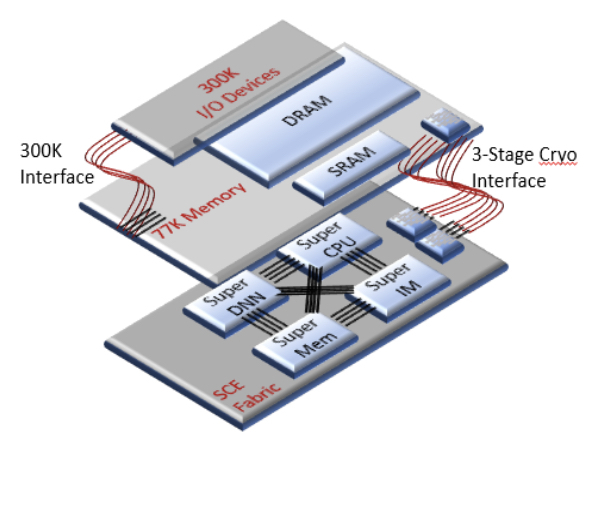
Full circuit visualization
-
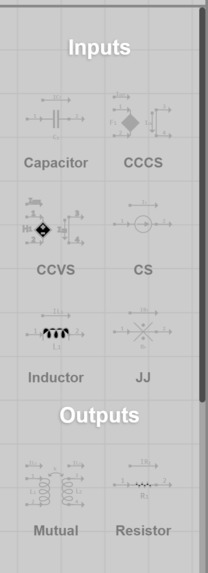
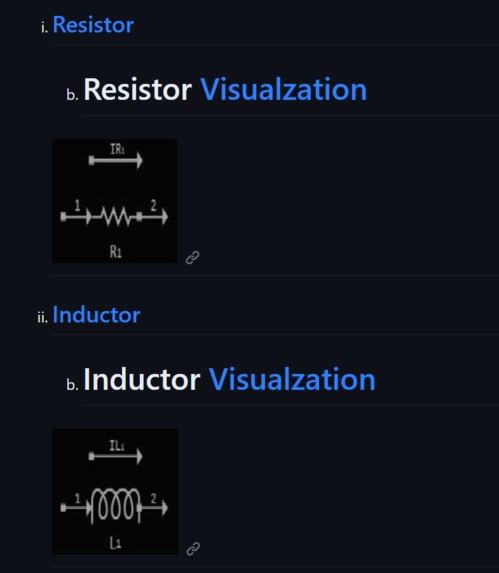
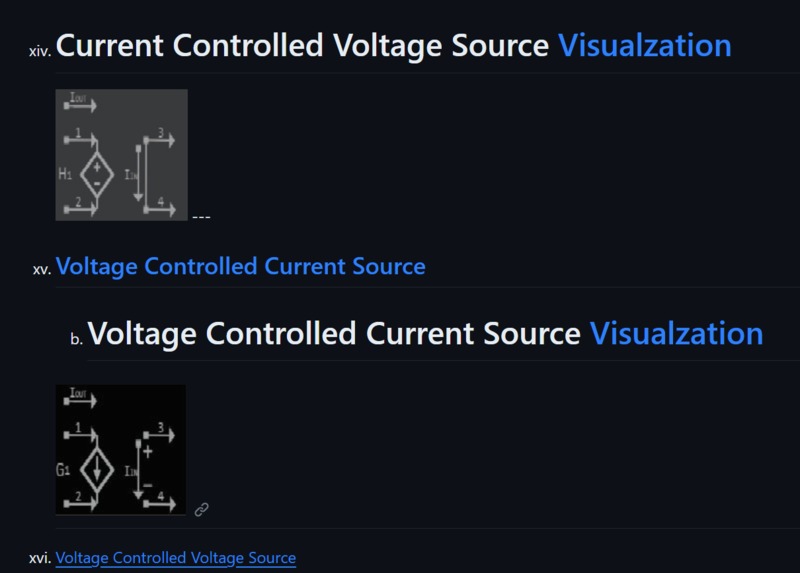
Parts of circuit visualization
-
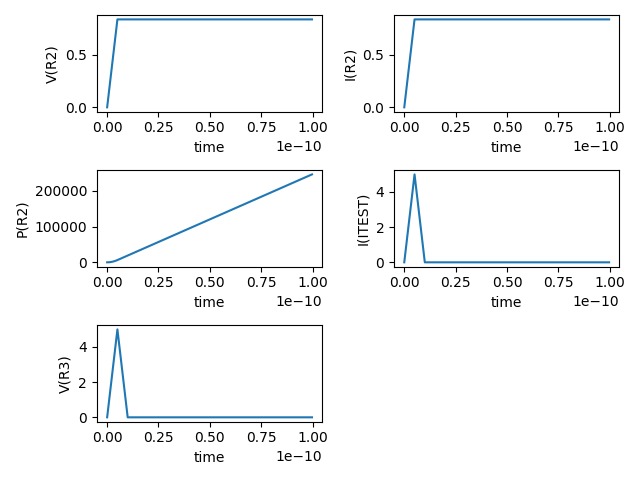
Resistor graph values
-
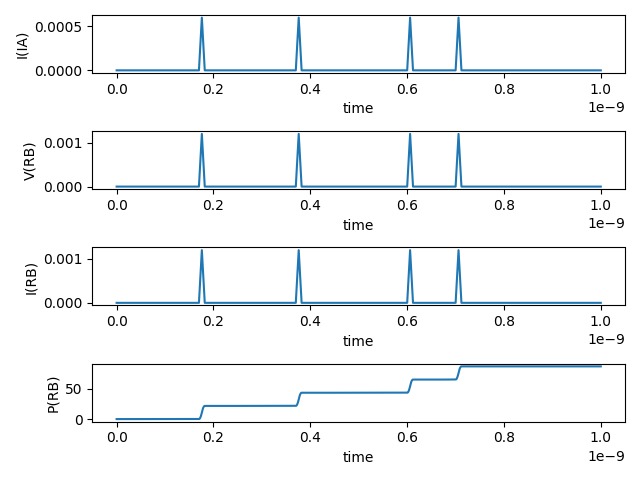
Full circuit graph values (current controlled voltage source)
-


Inspiration
Advancement of the fundamentals of computing
What does it do?
The superconductor simulation visualizes a superconductor's respective data as well as multiple examples of superconductors and circuits.
How did we build it?
We used the git repository JoSim to calculate data for the superconductors in C++ and Python and used the JoSIM documentation to help gather the data into a CSV file. This file was then used to visualize the data associated with the superconductors.
What issues did we run into?
We ran into issues with the tech stack and found difficulty in manipulating the data in order for it to be properly visualized.
Which accomplishments are we proud of?
We faced many challenges attempting to visualize the data and display it properly, so it was an accomplishment that we were proud to achieve.
What did we learn?
We learned about common data science processes and data manipulation as well as data visualization. We also learned about the workflow of many different technologies.
What's next?
We plan to continue to update the number of visualized superconductors and allow customizability for user-submitted superconductor data.


Log in or sign up for Devpost to join the conversation.