-
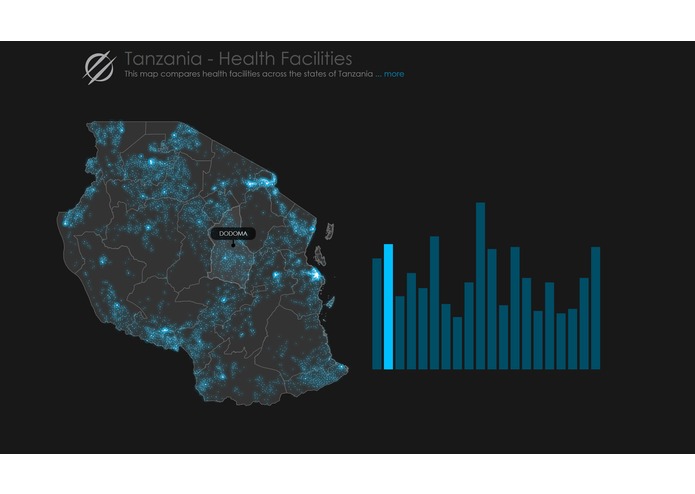
Health Facilities - how health facilities are spread across the country
-
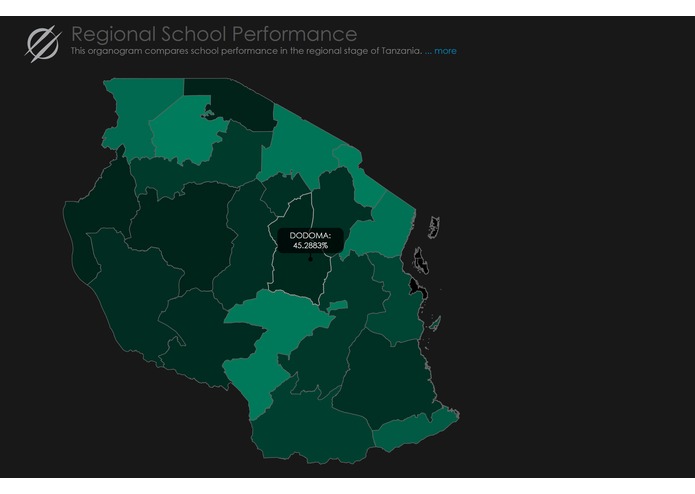
Educational Perfomance - regional differences made visual with educational performance organograms
-
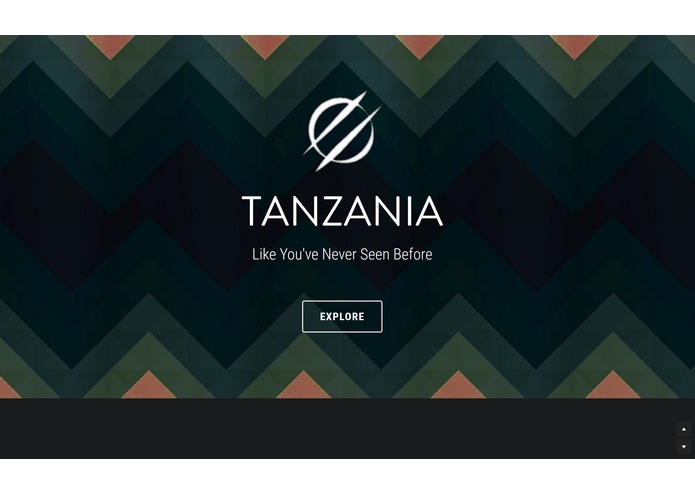
Homepage - the living form of a new brand
-
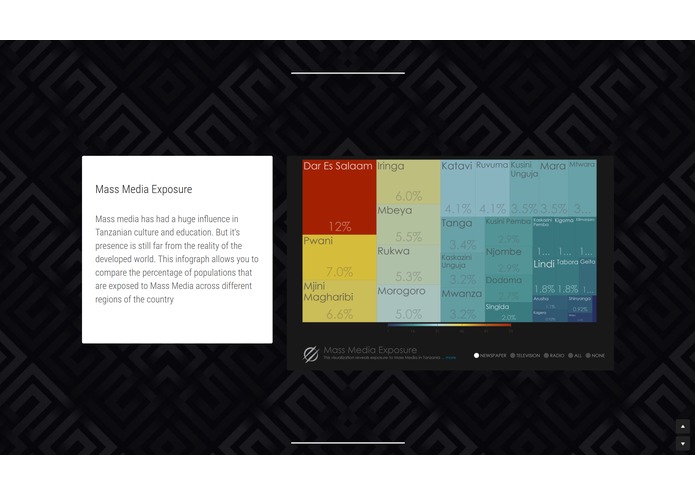
List of visualizations - how we came to organize all the visualizations and project we came to engage with.


Inspiration
Inspired by the impressive impact that social computing can generate with data analysis and information spreading, our project has experienced tons of brainstorms before being consolidated - from the layout and presentation of the visualizations themselves to the creation of a new, original and unique brand for the website.
What it does
Tanzania visualized is able to decodify Tanzanian Government's data and create beautiful, intuitive and inspiring visualizations and graphs, in order to allow better information spread, as well as new perspectives on social, economic and political situations around the country.
How we built it
Based on both d3.js and d3plus, our project uses HTML and CSS to host a java script run visualization. Data is downloaded instantly from governmental databases, while the powerful system of both d3s generate visualizations.
Challenges we ran into
Most of the challenges, instead of being based on codes, were based on the design problem itself: how to present all these information in a concise and cohesive way, such that people intuitively can understand it?
Accomplishments that we're proud of
The visual results have been fantastic. We're really impressed with the amount of information we can use to generate such complex patterns, and we're even more impressed with the resulting information we can extract from the visualizations themselves.
What's next for Tanzania Visualized
Let's hope for the best :)
Built With
- css
- d3.js
- d3plus
- html
- javascript

Log in or sign up for Devpost to join the conversation.