-
-
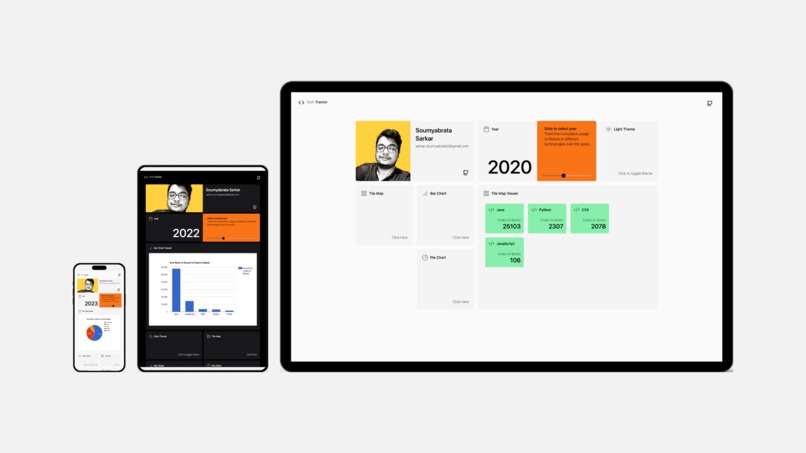
Tech Tracker Image

Inspiration
The inspiration behind Tech Tracker stemmed from a desire to help developers gain a clear, visual overview of their technical journey over the course of a year. By tracking the technologies they’ve used and the volume of code written, developers can identify trends, areas of growth, and opportunities for learning. The goal was to create an app that provides both personal insights and motivation, while also allowing developers to showcase their progress in a visually appealing way.
What it does
The Tech Tracker App allows developers to log and track the technologies they have used throughout a specific year. It provides a way to input the number of lines of code written for each technology, and offers a visual representation of this data using Google Charts. The app integrates with the GitHub API to fetch relevant data related to the technologies used by the developer. Users can view this data through a React.js frontend, with the backend powered by Node.js and Express.js.
How we built it
The Tech Tracker App is built with a combination of frontend and backend technologies:
Frontend: The user interface is built using React.js, which offers a dynamic and responsive experience. Data visualization is handled using Google Charts, which allows us to present the tracking data in an interactive format.
Backend: The backend API is built with Express.js running on Node.js, providing RESTful endpoints for managing and processing data. The backend also integrates with the GitHub API to fetch relevant code usage statistics from a user’s GitHub repositories.
Docker: The application is dockerized for easy deployment, with both frontend and backend services set up in containers. Docker Compose is used to manage these services together, ensuring a smooth development and deployment experience.
Challenges we ran into
Some of the challenges encountered during development included:
API Integration: Fetching data from the GitHub API required handling authentication and dealing with rate limits. Properly parsing and organizing the data to ensure accurate tracking of technologies used was also complex.
Data Visualization: Creating meaningful and interactive data visualizations with Google Charts was a challenge. Ensuring that the data was presented clearly and could be easily understood required careful consideration of chart types and how to represent large datasets.
Docker Setup: Setting up Docker Compose for both the frontend and backend services involved ensuring the services communicated properly and were configured to handle production-level traffic.
Cross-Origin Resource Sharing (CORS): Managing CORS between the frontend React app and backend services required adjusting server configurations to ensure smooth communication across different domains during development and production.
Accomplishments that we're proud of
- Successfully integrated the GitHub API to automatically track technologies used based on real code contributions.
- Created an intuitive React.js frontend that displays user data in a visually appealing and interactive way using Google Charts.
- Dockerized the application, making it easy to deploy and manage, either locally or on a cloud platform.
- Developed a seamless user experience with responsive interfaces and a simple RESTful API that manages backend logic.
These accomplishments make the app functional, scalable, and easy to use, offering value to developers who want to track their tech usage and productivity.
What we learned
- API Integration Best Practices: Learning how to authenticate with external APIs like GitHub and handle data fetching efficiently was a valuable experience.
- Data Visualization: The importance of using charts and graphs to present complex data in a clear and interactive manner was a key takeaway.
- Docker: Gaining hands-on experience with Docker and Docker Compose allowed us to better understand containerization and its role in modern app deployment.
- React and State Management: Building a frontend with React and managing state through various hooks taught us best practices for building scalable, maintainable web applications.
What's next for Tech Tracker
- User Authentication: Adding user authentication (such as OAuth with GitHub) to allow users to securely log in and personalize their tracking experience.
- Improved Data Analysis: Expanding the app’s data analysis capabilities by adding features like monthly or weekly breakdowns of technologies used, or the ability to track specific types of code (e.g., frontend vs backend).
- Mobile Version: A mobile-optimized version of the app or even a dedicated mobile app to track technology usage on-the-go.
- Public Sharing: Enabling users to generate shareable links or export their data to share with others or showcase on professional platforms like LinkedIn.

Log in or sign up for Devpost to join the conversation.