-
-
Index Page
-
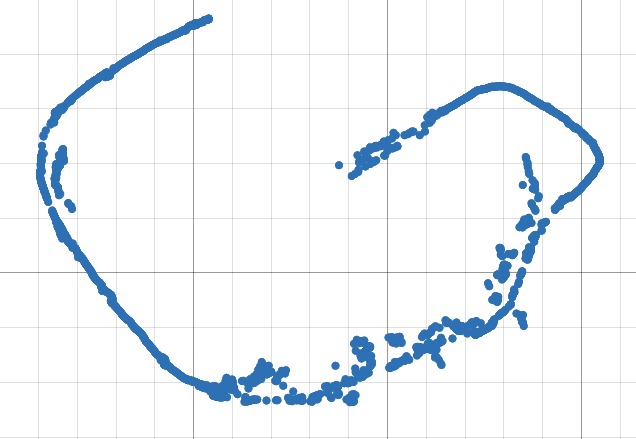
Raw Data Display
-
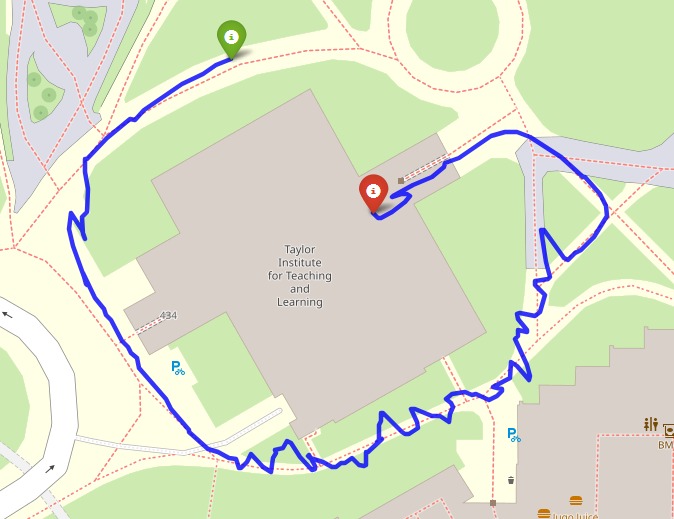
Folium map
-
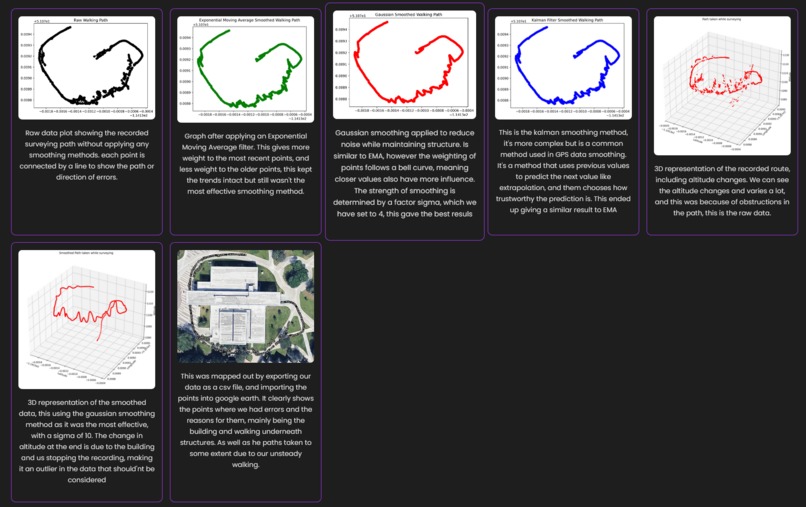
Gallery of methods


G-Hacks 2025: GPS to Remove Stress
Overview
This project, TerraHex, was developed as part of the G-Hacks 2025 Hackathon by Team G5 (Asim Hamdan, Neeor Alam, and Constantine Saev) on February 22-23, 2025. The project focuses on GPS data analysis and smoothing techniques to better understand real-world navigation errors and improve positioning accuracy.
Project Goals
- Analyze GPS data collected from surveying.
- Apply various smoothing methods (Gaussian, EMA, Kalman Filtering) to reduce errors in altitude readings.
- Visualize GPS data through 2D, 3D, and animated plots.
- Identify sources of error in GPS readings and their impact on real-world tracking.
Key Sections of the Website
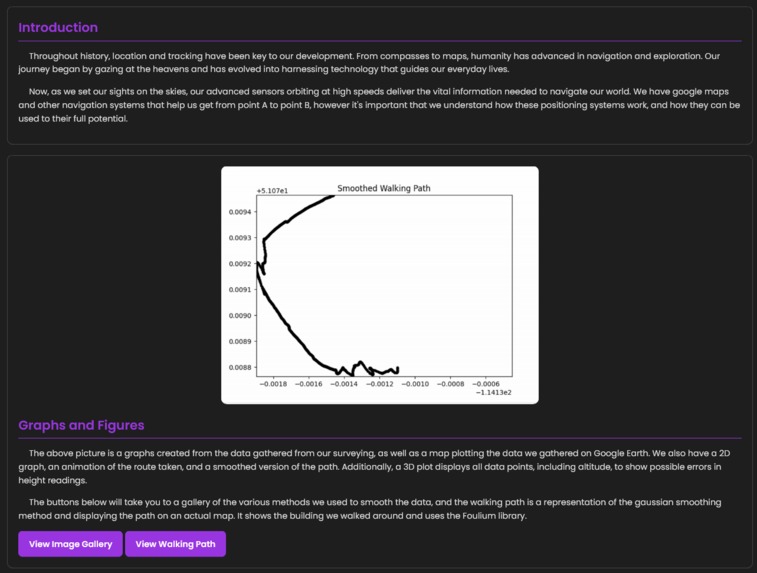
Introduction
- Explains the importance of navigation and GPS tracking.
- Discusses how sensors collect and process location data.
Graphs and Figures
- Displays 2D and 3D plots of the surveyed walking path.
- Includes an animated route visualization.
- Features a smoothed version of the path to correct noise.
Sources of Error
- Discusses GPS inaccuracies due to buildings, trees, and terrain.
- Highlights how data smoothing reduces, but doesn’t eliminate errors.
Conclusion
- Reflects on the importance of geomatics in modern navigation.
- Discusses lessons learned from using Hexagon's surveying equipment.
- Evaluates the effectiveness of Gaussian smoothing in reducing noise.
Logbook
- A detailed timeline documenting our workflow over February 22-23, 2025.
- Tracks progress from data collection to website finalization.
Technical Features
- GPS Data Processing: Extracts, analyzes, and visualizes longitude, latitude, and altitude.
- Smoothing Methods Implemented:
- Gaussian Smoothing (Best performing method)
- Exponential Moving Average (EMA)
- Kalman Filtering (Advanced predictive smoothing)
- Visualizations:
- Matplotlib for static graphs
- Folium for interactive maps
- Matplotlib Animation for route playback
- Web Technologies Used:
- HTML, CSS for the website
- Python for the data processing and plotting
How to Use
- Navigate through the website to explore graphs, visualizations, and analysis.
- View the interactive walking path (smoothed GPS data plotted on a real map).
- Check the logbook for insights into the team's development process.
- Access the full dataset via the table of averaged data.
Future Improvements
- Implement celestial body tracking for more fun information
- Integrate machine learning models to predict and correct GPS errors from buildings and trees.
- Develop a mobile-friendly version website.
Team Members
- Asim Hamdan (Data Processing & Algorithm Development)
- Neeor Alam (Visualization & Web Development)
- Constantine Saev (Data Collection & Analysis)
Acknowledgments
We sincerely thank Hexagon for providing the surveying equipment and the G-Hacks 2025 organizers for this opportunity to innovate in the field of geomatics and GPS technology.


Log in or sign up for Devpost to join the conversation.