-
-
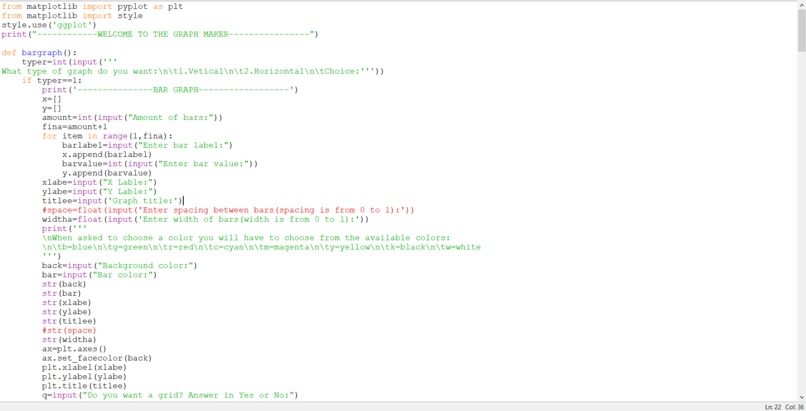
Some of my code

My Inspiration or motive behind it was when my teacher gave us an assingment to do. In that assignment we had to make online graphs and submit it. Google drawings is the only thing she knew. But it is very hard to make graphs of that, so I decided to create this so I don't have to worry about wasting a lot of times in creating graphs.
This machine basically takes all the data needed for the line graph and bar graph. They for the design or styling you can tell which colors you want. Then it creates the final product to download and use for anything like assignments or general.
I built it with python and the python library called matplotlib.
Challenges I ran into were trying to find a way in which I can allow users to choose a lot of points on their line graph.
Accomplishments that I'm proud of is making this a very simple program which can build graphs for you in very less time. It
What I learned was that you have to convert an input into a float to allow decimal number.
The next step to this project is to allow more lines to be made and make pie charts, scatter diagrams, and other type of graphs.
Built With
- idle
- matplotlib
- python

Log in or sign up for Devpost to join the conversation.