-
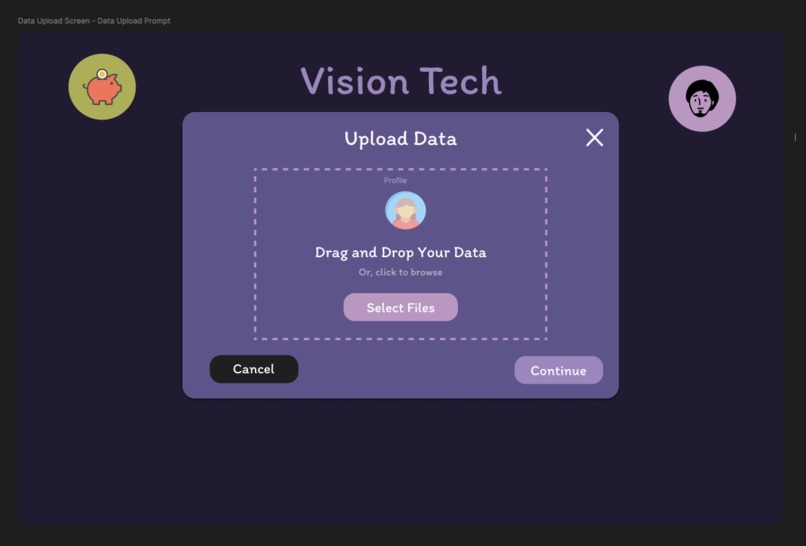
Upload Data Screen
-
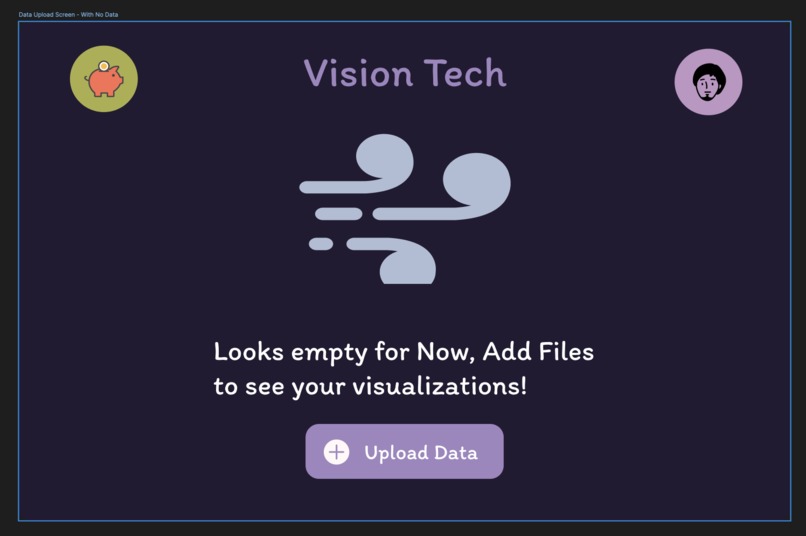
Empty Data Screen (Inspired by github's empty notifications)
-
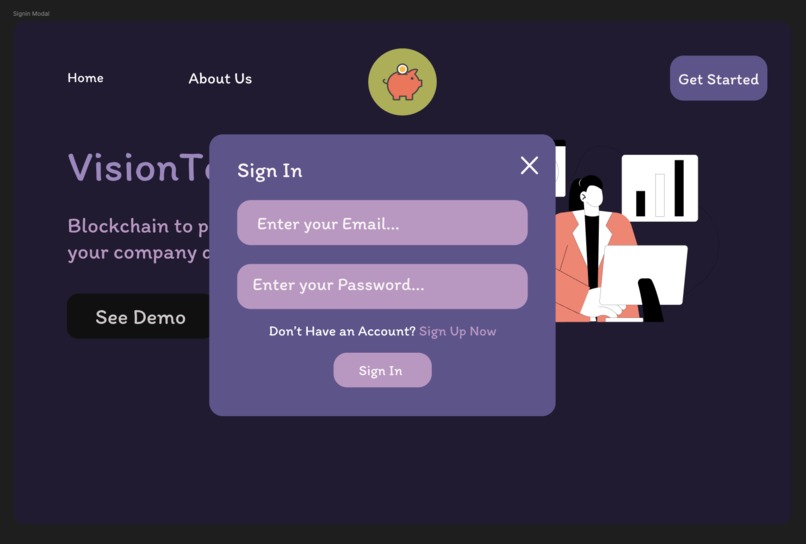
Sign In Screen
-
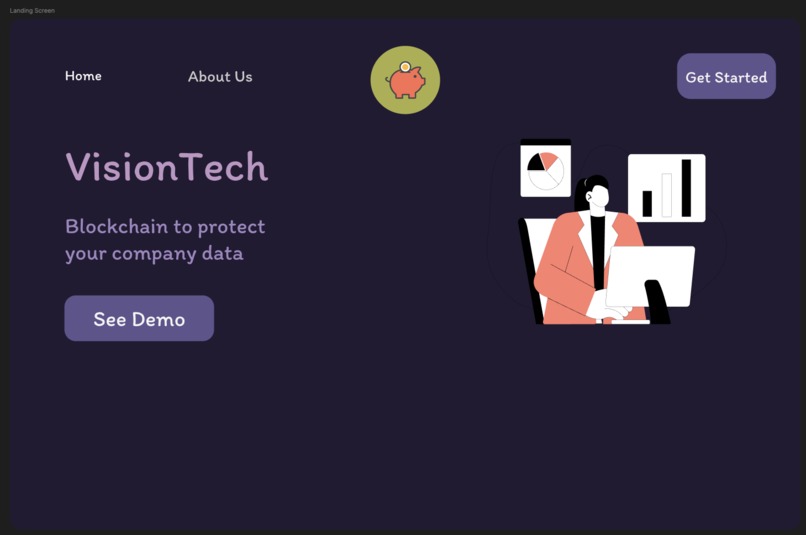
Landing Page Screen
-
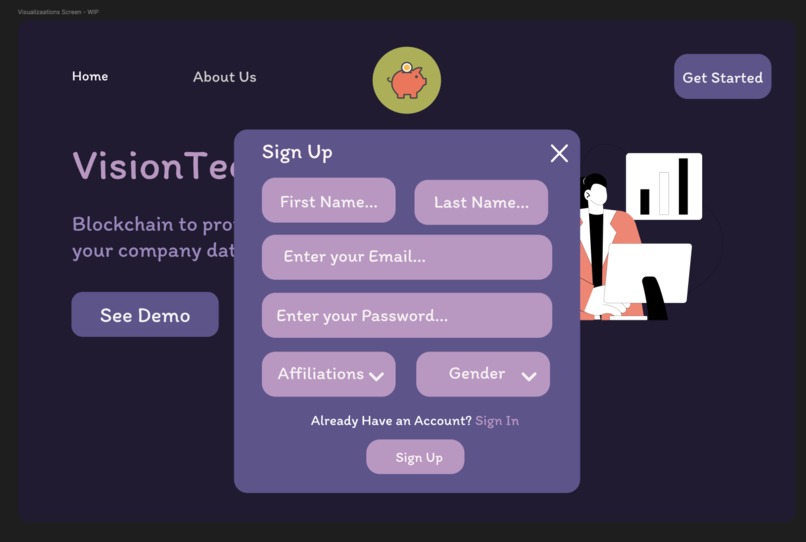
Signup Screen
-
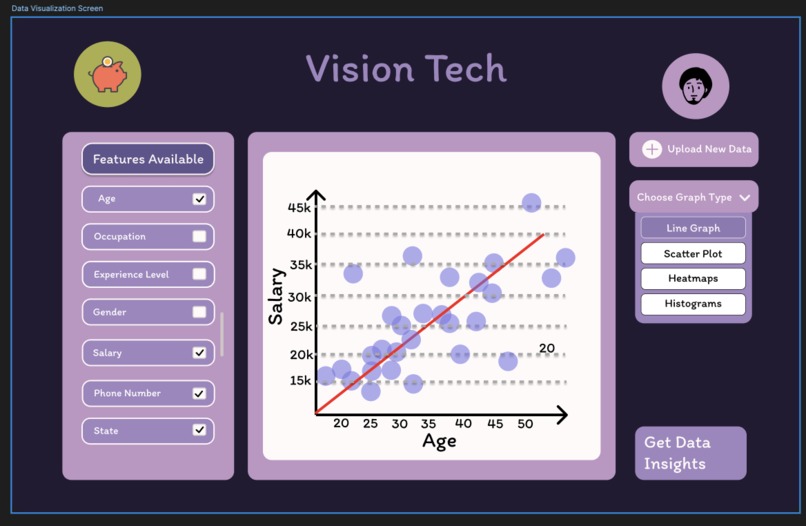
Data Visualization Screen (Inspired by Tableau)


Inspiration
The idea came from star micronics, where based on the data provided by a company, they will be able to gain insights and understanding of the data in order to make data-driven decision. A software that does this would be tabeleau, since data visualization is an essential factor at understanding the insights that the data we are working with provides. However, tableau requires a paywall for it's uses, despite it's simplicity of use and advanced customization capabilities to draw connections between different data, we wanted to create a free alternative to this while also harnessing the power of Artificial Intelligence or generate insights/conclusions on the data provided.
What it does
Users can login, whose input information will be encrypted using midnight and saved onto postgres database. Upon doing so, the data they upload, whether CSV or PDF based data, will also be encrypted prior to being saved onto the database for enhanced layer of security. Then the uploaded data can be visualizated using various forms of graphs : [scatterplot, heatmaps, linear regressions, line graphs, histograms, etc.] as well as choosing from the features that they are interested in.
How we built it
We did the preliminary design/wireframing using figma, we setup the API endpoint using cloudflare AI and hosted it on .tech domain as it was planned to later be used to generate insights on the data that has been uploaded. The storage and retrieval were to be done using prisma that serves as a middleware towards postgres and the frontend developmental work was to be done using Next.Js, tailwindcss and shadcn for pre-build starter components.
Challenges we ran into
Web development is significiantly slower in terms of progress compared to mobile development, pre-dominantly because there's much more things to consider when it comes to user interface. Additionally, certain factors such as user authentication endpoints, database connection, responsive design with a mobile first approach and adhering to the figma design all adds additional layer of complexity. While we were able to come up with a suitable figma design for the application, it fell short on the implementation, only being able to implement 1.5 pages, primarily UI that lacks functionality.
Accomplishments that we're proud of
In terms of accomplishments, we were able to learn more in-depth about figma, as well as visualization libraries and cloudflare AI's uses and how it can be utilized. Additionally, also learned additional information about UI libraries such as shadcn, and how midnight works, alongside exposure to decentralized applications.
What we learned
We learned how html's file upload works, as well as more in-depth understanding of tailwindcss and how it can be used to create more responsive UIs, and in addition we learned how figma works. Additionally, we learned how midnight works in terms of setting up ledgers and encryption logic as well as how cloudflare's API can be used for LLM based applications.
What's next for Vision Tech
We will continue to incrementally adopt to the figma design over the next week or two and ensure that all the functionalities and encryption are in place, ensuring that once deployed, users can use it as part of their personal data visualization toolkit.
Built With
- cloudflare
- midnight
- nextjs
- shadcn
- tailwindcss
- typescript

Log in or sign up for Devpost to join the conversation.