-
-
 GIF
GIF
Behavior Predator Logo
-
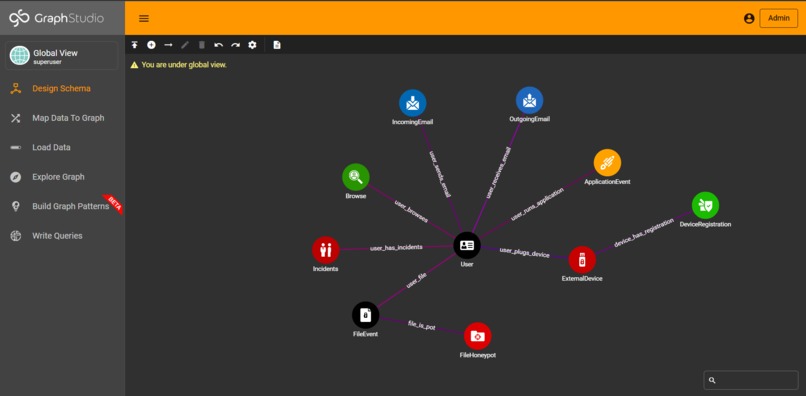
Graph Schema
-
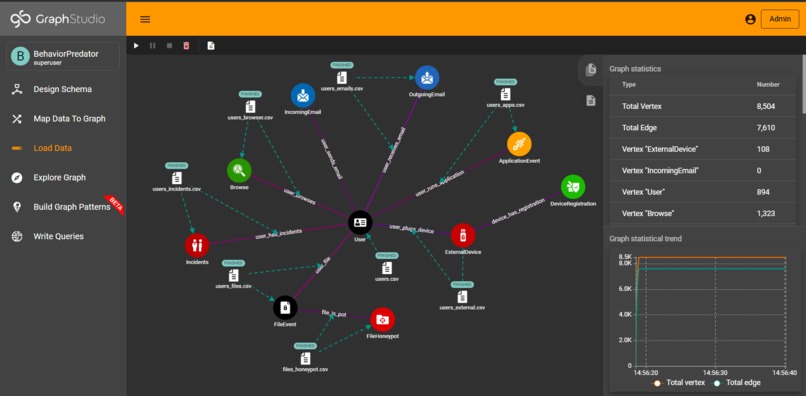
Import Past Data or Populate graph from zero
-
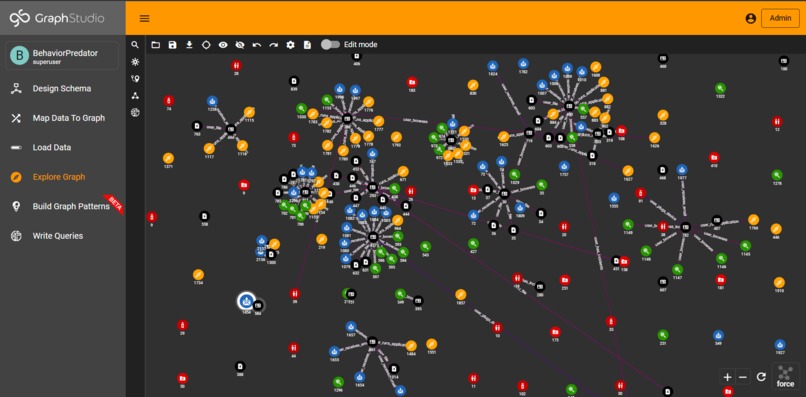
Visualize the relationships between Users, FileEvents, ApplicationEvents, and much more!
-
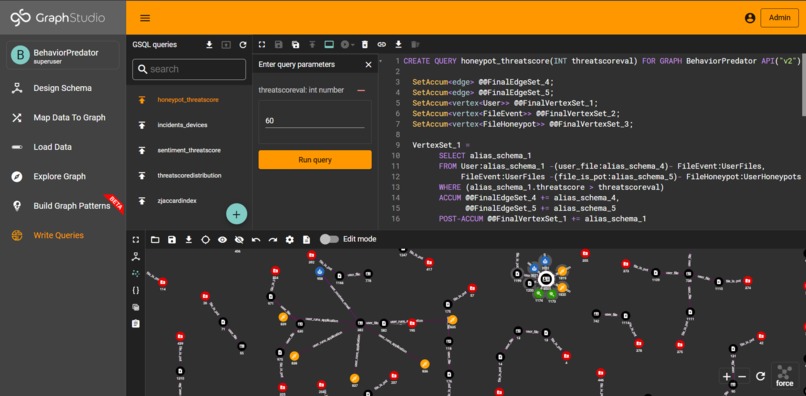
Find Known Insider Threats using GSQL queries
-
 GIF
GIF
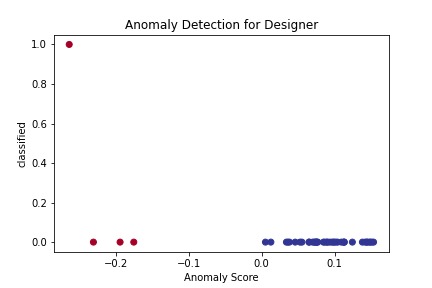
Anomaly Detection using an Isolation Forest. Blue points were categorized as normal and Red points as anomalies
-
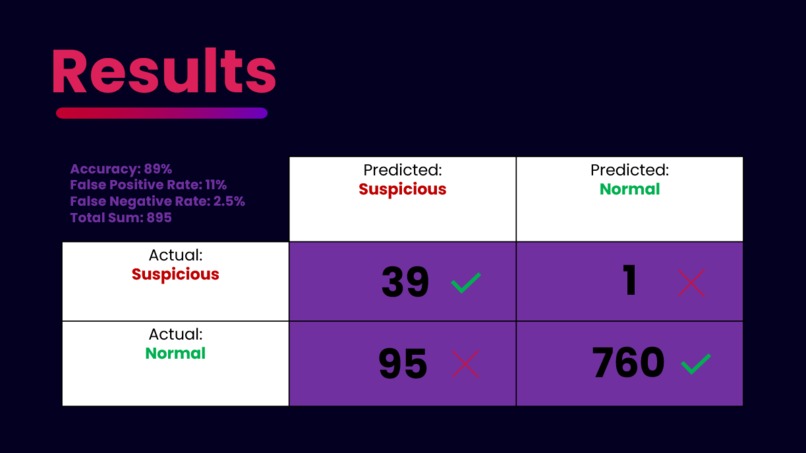
Metrics about Anomaly Detection using the Isolation Forest
-
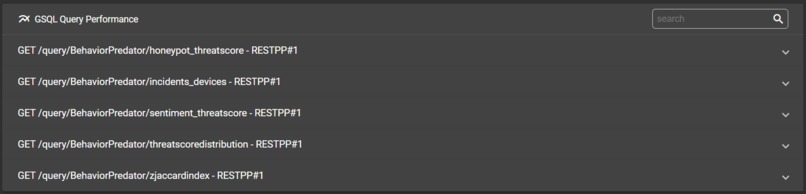
REST API


Our inspiration for BehaviorPredator:
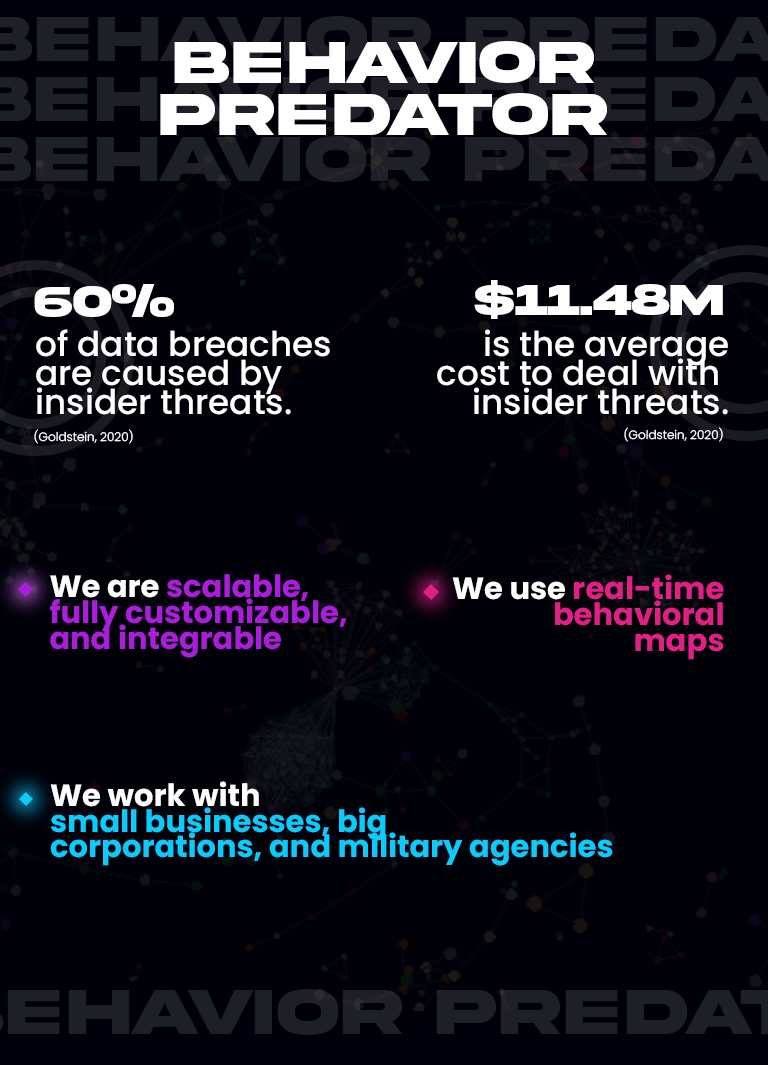
60% of data breaches are caused by insider threats (Goldstein, 2020) and the average cost of insider threats reaches more than $11.45 million in 2020. That is 31% more than the cost of insider threats in 2018. While current tools in the market provide some ways to identify these insider threats, they fail to flexibly adapt to the changing and fickle needs of organizations and people. Most solutions on the market do not focus on monitoring insider threats and those that attempt to do so are largely manual, unintelligent, and slow.
We created BehaviorPredator to be highly adaptable for new insider threats that emerge in the cybersecurity world.
What does BehaviorPredator do?
BehaviorPredator is a scalable, fully-customizable, and integrable solution that focuses on identifying insider threats on companies of any size from medium-sized businesses to big corporations and military agencies.
The solution is able to map the behaviors of employees in real-time using data inputs such as computer logs, file & folder manipulation, external device usage, email communications, incident reports, and much more!
This data is then able to be browsed and analyzed in TigerGraph. After that, the user is able to run a series of GSQL queries to identify known suspicious behaviors and expand on potential threats. Users are able to create new rules using the BehaviorPatterns.
In addition to providing support for identifying known suspicious behavior, BehaviorPredator is able to identify unknown insider threats by leveraging the use of group behavior analysis with unsupervised machine learning. This gives the ability for BehaviorPredator to single out those that pose a danger to the organization.
How did our team build it?
To build the graph schema, we researched different types of data that can be collected under the laws of Employee Data Privacy in the United States. From there, our team discussed what interesting parameters we can derive from each type of data. (E.g.: Deriving sentiment scores for all email communication)
After defining the graph schema, we created a program to simulate user activities happening during work. This data was then loaded into the graph in order to begin multiple analyses. We wrote a few GSQL queries in order to demonstrate the potential of insider threat analysis using Tigergraph.
Currently, the users are able to explore the entire userbase, find users with a certain threat score, find users that triggered honeypot files and exceed a threshold of threat score, find users that sent emails with attachments with low sentiment scores, and find users who recently plugged external devices with a record of incidents. More rules like those GSQL queries can be created by writing graph patterns on TigerGraph.
In order to identify unknown insider threats, BehaviorPredator uses data from the ApplicationEvents, FileEvents, and Browse vertices to compile a dataset of user behavior activity that is processed with an Isolation Forest model by roles in order to find anomalies. Each job role (Software Engineers, Intelligence Officers, Designers, etc.) has an Isolation Forest model that is able to find employees that stand out from the group of employees.
The user behavior dataset shows how much time each user spends in a category of a task. Simplified Example: "Nate is a Software Engineer and he spends 60% of his day on code-related tasks, 20% of his day performing network activities, and 20% on databases."
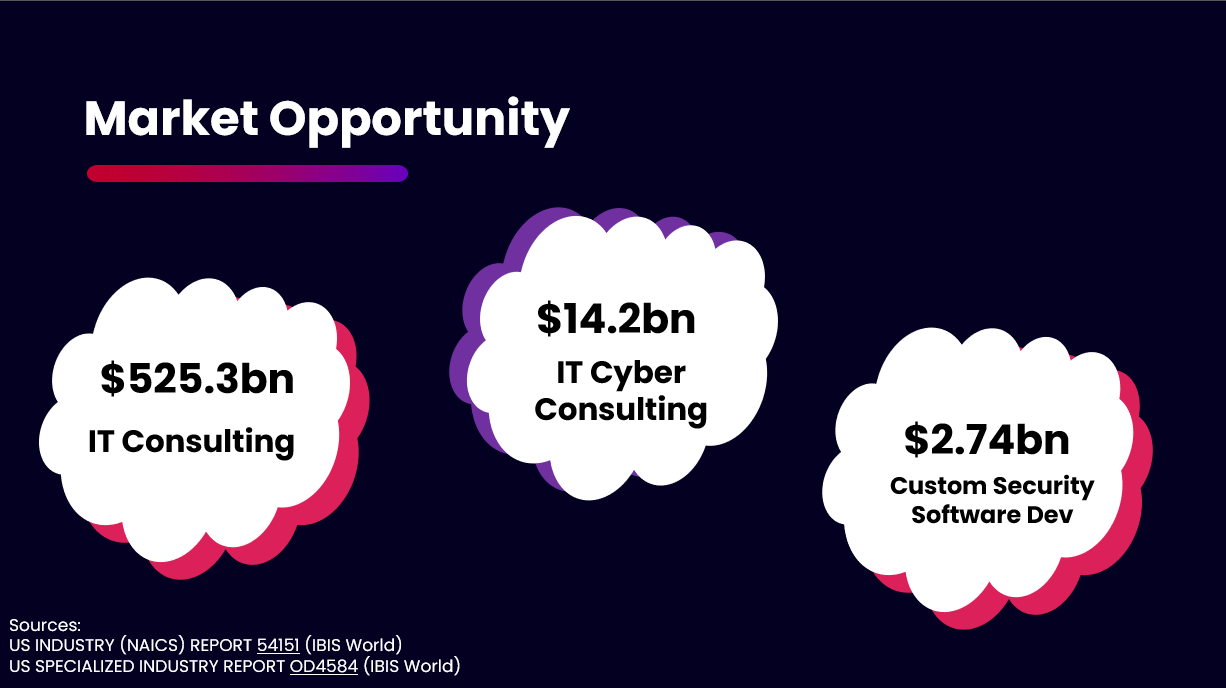
Our Market Opportunity
Challenges we ran into
After personally being victims of problems caused by insider threats, we set out to solve this problem using TigerGraph. It was our first time using graph databases and Tigergraph, so we had to read multiple tutorials and watch videos. Luckily, there were plenty of resources to get started!
Creating GSQL queries from scratch was a little intimidating in the beginning but after exploring with TigerGraph's new feature of building graph patterns, we were able to get a few templates. We believe having the ability to create queries with blocks of code or even extending the client libraries to minimize the amount of GSQL written could be very beneficial to streamlining the developing process for newcomers.
What are we proud of? What did we learn?
We are proud to have developed such a cool platform that is able to create an impact in the world of cybersecurity. We were very happy for the opportunity to use TigerGraph in a hackathon and we hope we see more hackathons sponsored by TG. We want to learn more about graphs and the potential of developing tools with the platform.
What's next for BehaviorPredator?
Our team is looking forward to developing a more user-friendly version of BehaviorPredator. We would like to develop a client-side that communicates with TigerGraph and that can be managed by security engineers in different companies. We also would like to improve the accuracy metrics of our anomaly detection algorithms, integrate with other third-party solutions, and better deal with false positives. In the future, we want to expand the list of rules that can be used and also implement other techniques of anomaly detection.
Built With
- gcp
- gsql
- python
- tigergraph


Log in or sign up for Devpost to join the conversation.