This week is about highlighting differences and visualizing characteristics over the data itself.
focus
-
Members Only

Spot the difference
-
Members Only
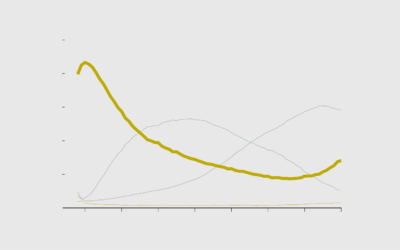
Focusing Off Defaults
Default visualization settings are useful when it’s just you analyzing data. However, visual focus is better when it’s time to present.
-
Members Only
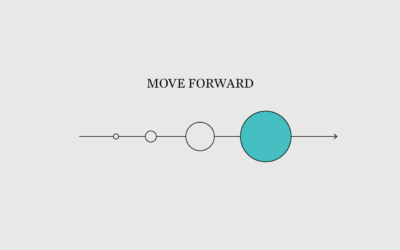
Pushing Out the Charts
In the land of what-if and what-about, it’s surprisingly easy to get stuck staring at your work, thinking about how your audience will hate it. You have to let it go.
-
Members Only
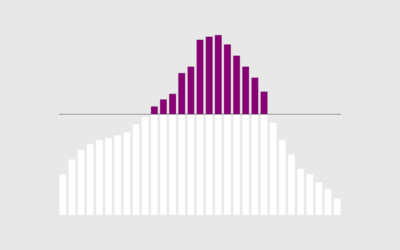
Focus Change
A few lines and a color fill can change how others see a dataset.
Recently for Members
Second Edition
 Visualize This: The FlowingData Guide to Design, Visualization, and Statistics (2nd Edition)
New tools, refined process.
Browse by Chart Type See All →


