
Download Open Knowledge Maps – AI‑Powered Visual Search for Scientific Literature
Overview
Open Knowledge Maps is a cutting‑edge web application that transforms the way researchers discover, explore, and understand scientific literature. Powered by artificial intelligence, the platform acts as a visual search engine that automatically generates interactive maps of research topics, highlighting key papers, emerging trends, and core concepts. Unlike traditional keyword‑based databases, Open Knowledge Maps presents the scholarly landscape as an intuitive, zoom‑able map, making it easier for users to spot connections, identify gaps, and dive directly into the most relevant studies.
The service is built on the principles of open science and operates as a non‑profit initiative. This means that all visualizations are freely accessible, and the underlying data can be reused under permissive licenses. Whether you are a Ph.D. candidate mapping out a dissertation, a research team conducting a systematic review, or an organization looking to embed AI‑driven literature discovery into its own workflow, Open Knowledge Maps provides a collaborative, transparent, and sustainable infrastructure.
Beyond its visual search capabilities, the platform offers export options, API access for developers, and a community‑driven knowledge base that continuously improves the quality of the maps. By aggregating metadata from multiple scholarly sources—including Crossref, PubMed, arXiv, DOAJ, and many open repositories—the tool ensures comprehensive coverage across disciplines. In short, Open Knowledge Maps is not just another literature search tool; it is a visual knowledge hub designed to accelerate scientific discovery while keeping the process open, inclusive, and user‑friendly.
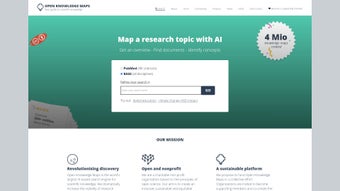
The user experience is deliberately streamlined. When you first land on the homepage, a short onboarding tooltip explains how to enter a query, select a visualization style, and interact with the generated map. The interface adapts to your device, delivering a responsive layout that works equally well on a high‑resolution desktop monitor and a handheld tablet. For those who prefer a more personalized workflow, an optional account stores saved maps, custom collections, and annotation histories, all protected by modern encryption standards. This blend of simplicity and depth makes Open Knowledge Maps a valuable asset for both novices and seasoned scholars.
In addition to its core features, the platform fosters a vibrant community. Researchers can contribute feedback, suggest new data sources, or even submit code patches to the open‑source visualization library. This collaborative model not only improves the tool over time but also aligns with the broader goals of open research—making knowledge more accessible, reproducible, and interoperable across institutions worldwide.
Key Features & Functionalities
- AI‑Generated Visual Maps: Automatic clustering of publications into topic‑based nodes that can be explored interactively.
- Multi‑Source Aggregation: Pulls metadata from Crossref, PubMed, arXiv, DOAJ, and other open repositories for comprehensive coverage.
- Concept Extraction: Highlights the most frequent keywords, methods, and findings within each cluster.
- Export & Sharing: Download maps as PNG, PDF, or embed them via iframe; share via a permanent URL.
- API & Integration: RESTful API allows developers to embed map generation into custom dashboards, institutional repositories, or learning platforms.
- Collaborative Annotations: Users can add notes, rate relevance, and suggest corrections that feed back into the AI model.
- Responsive Design: Fully functional on desktop browsers, tablets, and mobile devices without the need for a separate app.
- Open‑Source Components: Core visualization library is released under an MIT license, encouraging community contributions.
- Secure & Private: No personal data is stored unless the user creates an optional account for saved maps.
- Continuous Updates: The AI model is retrained monthly with newly indexed papers, ensuring up‑to‑date visualizations.
Each of these features works together to provide a seamless research experience. For example, the AI‑generated clusters are not static; they adapt as new literature is published, meaning that the same search query next month may reveal emerging sub‑topics that were previously invisible. The API is especially valuable for institutions that want to embed visual literature discovery directly into their digital libraries or learning management systems, turning a simple search bar into a dynamic knowledge explorer.
The collaborative annotation system fosters a sense of community ownership. Researchers can flag mis‑classified papers, suggest alternative keywords, or add context that benefits future users. This crowd‑sourced feedback loop improves both the accuracy of the visual maps and the relevance of the underlying AI model, aligning perfectly with the open‑science ethos of the platform.
Performance‑wise, the platform leverages modern web technologies such as WebGL for rendering large graphs, ensuring smooth zoom and pan even with thousands of nodes. Lazy loading techniques reduce initial load times, while client‑side caching speeds up repeat queries. For power users, the API returns raw JSON data, enabling custom visualizations or integration with citation managers like Zotero and Mendeley.
Finally, the export options make it easy to incorporate visual maps into presentations, grant proposals, or teaching materials. Whether you need a high‑resolution PNG for a conference poster or an embeddable iframe for a university website, Open Knowledge Maps provides a straightforward workflow that eliminates the need for third‑party graphics software.
Installation, Setup & Daily Use
Getting Started – No Download Required
Open Knowledge Maps is a web‑based service, so there is no traditional installation process. To begin, simply navigate to openknowledgemaps.org using any modern browser (Chrome, Firefox, Safari, Edge). The site automatically detects your device and loads an optimized interface, ensuring a fast start on both Windows and macOS desktops as well as Android and iOS tablets.
Creating Your First Map
- Enter a query: Type a research topic, keyword, or DOI into the central search bar. The AI engine parses the input and retrieves relevant records from its aggregated databases.
- Select a visualization style: Choose between “Concept Map,” “Citation Network,” or “Timeline” depending on the perspective you need.
- Interact with the map: Zoom, pan, and click on nodes to reveal a list of associated papers, abstracts, and key concepts.
- Refine results: Use filter sliders to narrow by publication year, open‑access status, or citation count.
- Save or export: Click “Save Map” to store it in your personal dashboard (optional account) or download it directly as an image or PDF.
Account Features (Optional)
While the core functionality is free and does not require registration, creating an account unlocks additional conveniences such as saved maps, custom collections, and the ability to contribute annotations. Account creation follows a standard secure sign‑up flow with email verification and optional two‑factor authentication for enhanced security.
Integrating via API
For developers or institutions, the Open Knowledge Maps API provides programmatic access to map generation. After obtaining an API key (free for non‑commercial use), you can send a POST request with a JSON payload containing the search term and desired visualization parameters. The response includes a URL to the rendered map, which can be embedded in web pages or internal portals. Comprehensive documentation, example code snippets in Python, JavaScript, and R, and a sandbox environment are available on the developer portal.
Overall, the user experience is designed to be frictionless. From the moment you land on the homepage, the interface guides you through each step with tooltips and contextual help, making it suitable for both seasoned researchers and newcomers to scholarly search.
Advanced users can also leverage the “Batch Query” feature, which accepts a CSV list of topics and returns a zip file containing individual maps for each entry. This is particularly useful for literature review teams that need to explore multiple sub‑fields in parallel.
Pros, Cons & Compatibility
Pros
- Completely free to use for basic visualizations – no hidden fees.
- AI‑driven clustering provides an intuitive overview of complex research fields.
- Broad source coverage ensures interdisciplinary relevance.
- Responsive web design works across Windows, macOS, Linux, Android, and iOS.
- Open‑source visualization library encourages community extensions.
- Secure, privacy‑first approach – no personal data stored without consent.
- Regular AI model updates keep maps current with the latest publications.
- Export options (PNG, PDF, iframe) simplify sharing and publishing.
- API enables integration with institutional repositories and custom dashboards.
- Collaborative annotation system improves map accuracy over time.
Cons
- Requires an internet connection; offline access is not currently supported.
- Advanced API usage is limited to non‑commercial projects unless a paid tier is purchased.
- Some niche disciplines may have fewer indexed sources, leading to sparser maps.
- Large queries can take longer to process during peak usage periods.
- Customization of visual styles beyond the preset options is limited for free users.
- Optional account creation is required for saving maps long‑term.
Compatibility
Open Knowledge Maps runs entirely in the browser and is compatible with all major operating systems, including Windows 10/11, macOS 12+, Linux distributions, Android 9+, and iOS 13+. No additional plugins or software installations are required, and the platform adheres to modern web standards (HTML5, CSS3, JavaScript ES6) for optimal performance.
Frequently Asked Questions (FAQ) & Final Thoughts
Is Open Knowledge Maps truly free?
Yes. The core visual search and map export features are completely free for all users. A paid subscription is only required for commercial API usage or for advanced customization options.
Can I use Open Knowledge Maps for systematic reviews?
Absolutely. The platform’s ability to cluster related papers and display citation networks makes it an excellent starting point for systematic literature reviews, helping researchers quickly identify seminal works and research gaps.
How does the AI model determine clusters?
The AI combines natural‑language processing of titles, abstracts, and keywords with citation analysis. It then applies unsupervised clustering algorithms (e.g., hierarchical agglomerative clustering) to group publications with similar thematic content.
Is there a way to integrate Open Knowledge Maps with my institution’s library system?
Yes. The RESTful API can be called from any backend system, allowing libraries to embed interactive maps directly into their discovery portals or digital repositories.
What privacy measures are in place for user data?
Open Knowledge Maps stores no personal data unless a user voluntarily creates an account. All stored maps are encrypted, and the platform complies with GDPR and other international privacy regulations.
Can I export maps for use in presentations or publications?
Yes. Maps can be downloaded as high‑resolution PNG images, PDF files, or embedded via an iframe. The export process preserves vector quality, making the graphics suitable for academic posters, journal articles, and slide decks.
In summary, Open Knowledge Maps offers a powerful, AI‑driven alternative to traditional literature search engines. Its visual approach reduces the time spent sifting through endless lists of papers, while its open‑science foundation ensures that the tool remains accessible, transparent, and community‑focused. Whether you are a lone researcher plotting a dissertation, a team conducting a comprehensive review, or an institution seeking to enhance its discovery services, Open Knowledge Maps delivers a secure, free, and highly intuitive solution.
Ready to explore the scholarly landscape like never before? Visit Open Knowledge Maps today, generate your first visual map, and experience a new dimension of research discovery.
