Combine your love of baseball with coding skills to create something amazing, and code your way into America’s pastime
—
Why Baseball and Coding Are a Perfect Match
If you love baseball and want to learn programming, I have great news: they’re a perfect match! Both require attention to detail, pattern recognition, and problem-solving. Plus, baseball generates tons of interesting data that’s perfect for learning to code.
Inspired by professional analytics platforms like Baseball Savant, I’ll show you how to build your own interactive baseball statistics dashboard. By the end, you’ll have a working web application that displays player stats, team comparisons, and league leaders – all built with Python.
No prior coding experience? No problem! We’ll walk through everything step-by-step.
—
What You’ll Build
Your dashboard will have:
– 🔍 Player Search: Find any MLB player and see their stats
– 🏟️ Team Statistics: Compare teams and see rankings
– 🏆 League Leaders: See who’s leading in home runs, RBIs, and more
– 📊 Interactive Charts: Beautiful visualizations that make data easy to understand
And the best part? You’ll learn real programming skills while building something you can actually use!
—
Getting Started: Setting Up Your Environment
Step 1: Install Python
First, make sure you have Python installed. Open your terminal (Mac/Linux) or command prompt (Windows) and type:
python3 --versionThis command will output the current version of Python 3 that is installed, helping you ensure compatibility with scripts and packages.
If you see a version number (like 3.8.0 or higher), you’re good! If not, download Python from python.org.
Step 2: Create Your Project
Create a folder for your project:
mkdir baseball-dashboardcd baseball-dashboardStep 3: Set Up a Virtual Environment
A virtual environment keeps your project’s dependencies separate. Think of it like having a separate toolbox for each project:
python3 -m venv .venvOn Mac/Linux:
source .venv/bin/activateOn Windows:
.venv\Scripts\activateYou should see (.venv) appear in your terminal – that means it’s working!
Step 4: Install Required Packages
Create a file called requirements.txt:
shiny>=0.9.0
shinywidgets>=0.1.0
pybaseball>=2.2.0
pandas>=2.0.0
plotly>=5.0.0
numpy>=1.24.0
Then install everything:
pip install -r requirements.txtWhat are these?
– shiny: Makes building web apps super easy
– shinywidgets: Enables interactive Plotly charts
– pybaseball: Gets baseball data from the internet
– pandas: Helps us work with data tables
– plotly: Creates beautiful, interactive charts
—
Understanding pybaseball: Your Gateway to Baseball Data
Before building the dashboard, let’s understand what pybaseball can do. It’s like having access to all of baseball’s statistics at your fingertips!
What is pybaseball?
pybaseball is a Python library that fetches baseball statistics from websites like FanGraphs and Baseball Reference. Instead of manually copying data, you get it with code!
Your First Data Query
Let’s test it out. Create a file called test.py:
import pybaseball as pyb
import pandas as pd

# Get 2023 batting statistics
print("Loading 2023 stats...")
stats = pyb.batting_stats(2023, 2023)

# Show first 5 players
print("\nFirst 5 players:")
print(stats.head())

# Find the home run leader
hr_leader = stats.nlargest(1, 'HR')[['Name', 'Team', 'HR']]
print("\n🏆 2023 Home Run Leader:")
print(hr_leader)
Run it from your terminal with the below command:
python test.pyPretty cool, right? You just pulled real baseball data with code!
—
Building Your Dashboard: Step by Step
Now let’s build the actual dashboard. We’ll start simple and add features as we go.
Step 1: Create the Basic App Structure
Create app.py and copy all the code in EXAMPLE 2 in this gist (snippet of the code in my IDE below):

Step 2: Run Your Dashboard
Run your dashboard with the below command in your terminal:
shiny run app.pyYour browser should open automatically! If not, go to http://localhost:8000
—
Professional Styling (Already Included!)
The code example above already includes professional styling! Notice the ui.tags.head() section at the top of app_ui? That’s where we add:
– Custom fonts (Inter from Google Fonts) for a modern, clean look
– Gradient backgrounds for visual appeal
– Styled metric cards with shadows and rounded corners
– Professional color scheme with smooth transitions
The styling is integrated directly into the UI definition, so when you run the app, it will look polished right away. If you want to customize the colors, fonts, or styles, you can modify the CSS inside the ui.tags.style() section.
Note: The complete code example with all styling is available in the GitHub Gist – just copy and paste to get the full professional look!
—
Next Steps: Taking It to the Next Level
Once you have the basics working, here are some ideas to make your dashboard even more impressive:
1. Add More Statistics
– Pitching stats
– Fielding stats
– Advanced metrics (WAR, wOBA)
2. Enhanced Visualizations
– Scatter plots comparing players
– Heatmaps for team performance
– Time series charts showing trends
3. Advanced Features
– Compare two players side-by-side
– Save favorite players
– Export data to CSV
4. Professional Touches
– Better color schemes
– Responsive design
– Loading indicators
– Error handling
—
Inspiration: Baseball Savant
If you want to see what’s possible, check out Baseball Savant – MLB’s official Statcast platform. It features:
– Advanced Statcast Metrics: Exit velocity, launch angle, barrel rate
– Interactive Visualizations: 3D pitch tracking, spray charts
– Real-time Data: Live game updates
– Professional Design: Clean, modern interface
While your dashboard starts with basic stats, you can gradually add more advanced features as you learn!
—
Deploying Your Dashboard: Share It With the World!
Now that you have a working dashboard, let’s deploy it to the web so you can share it with friends, family, and the world!
Why Deploy?
Deploying your app means putting it online where anyone can access it. No need for them to install Python or run code – they just visit a URL!
Step 1: Create a shinyapps.io Account
1. Go to shinyapps.io
2. Click “Sign Up” (it’s free!)
3. Choose an account name (this will be part of your app URL)
4. Verify your email
The free tier gives you 5 apps and 25 hours of usage per month – perfect for learning!
Step 2: Install rsconnect-python
You need the rsconnect-python package to deploy. Install it:
pip install rsconnect-pythonStep 3: Get Your Deployment Token
1. Log in to shinyapps.io
2. Go to Account → Tokens
3. Click Add Token
4. Give it a name (e.g., “My Computer”)
5. Copy the command that looks like:
rsconnect add --account YOUR_ACCOUNT_NAME --name YOUR_TOKEN_NAME --token YOUR_TOKEN --secret YOUR_SECRETStep 4: Configure rsconnect
Run the command you copied in your terminal. This links your computer to your shinyapps.io account.
Step 5: Deploy Your App
Navigate to your project directory and run:
rsconnect deploy shiny . --name baseball-dashboard --title "Baseball Stats Dashboard"Replace `baseball-dashboard` with your desired app name (lowercase, no spaces).
Step 6: Access Your Live App!
Once deployment completes (takes 2-5 minutes), your app will be live at:
https://YOUR_ACCOUNT_NAME.shinyapps.io/baseball-dashboard/
That’s it! Share this URL with anyone. They can use your dashboard without installing anything!
See it in action: Check out a live example of my dashboard here using the same code.
Updating Your App
To update your deployed app with new features, just run the deploy command again:
rsconnect deploy shiny . --name baseball-dashboard --title "Baseball Stats Dashboard"It will automatically update your live app!
Troubleshooting
“Module not found” errors?
– Make sure all dependencies are in `requirements.txt`
– Check that package versions are compatible
Deployment fails?
– Ensure app.py has app = App(app_ui, server) at the bottom
– Check the shinyapps.io dashboard for error logs
App runs locally but not online?
– Some packages may not be available on shinyapps.io
– Test with a minimal version first
—
What You’ve Learned
Congratulations! You’ve learned:
– ✅ How to set up a Python development environment
– ✅ How to use pybaseball to get baseball data
– ✅ How to build an interactive web dashboard with Shiny
– ✅ How to create visualizations with Plotly
– ✅ How to organize code into a working application
– ✅ How to deploy your app to the web!
Most importantly, you’ve built something real that you can use and share with the world!
—
Resources
– Live Demo: See the dashboard in action here!
– Full Code: Check out the complete project in this feature branch on GitHub
– Shiny for Python Docs: shiny.posit.co
– pybaseball Documentation: GitHub
– Baseball Savant: baseballsavant.mlb.com
—
Need Help?
If you run into issues or have questions while building your dashboard, I’m here to help! You can:
– Open an issue on the GitHub repository
– Check the troubleshooting sections in this article
– Review the official documentation for Shiny and pybaseball
Building something new can be challenging, but don’t give up – every programmer started where you are now. I’m committed to helping others learn, so reach out if you get stuck!
—
Final Thoughts
Building a baseball dashboard is more than just a coding project – it’s a way to combine your interests, learn valuable skills, and create something meaningful. The skills you’ve learned here apply to so many other projects:
– Building dashboards for other sports
– Analyzing any kind of data
– Creating web applications
– Working with APIs and data sources
Keep coding, keep learning, and most importantly – keep having fun! ⚾💻
—
Want to share what you built? Post it on GitHub, write about it, or help others build their own dashboards. The coding community is friendly and always happy to help!


 denotes the mean of your sample of historical returns (daily or weekly etc) and
  denotes standard deviation, then
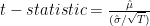


 then we can present the p-value of the single test as

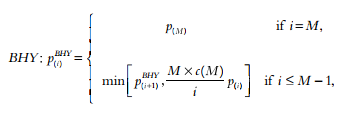
 could be represented as


![{p_i^{Bonferroni}} = min[M * {p_i}, 1]](https://s0.wp.com/latex.php?latex=%7Bp_i%5E%7BBonferroni%7D%7D+%3D+min%5BM+%2A+%7Bp_i%7D%2C+1%5D+&bg=FFFFFF&fg=000000&s=0&c=20201002)
![{p_{(i)}^{Holm}} = min[max((M - j + 1)*{p_{(j)}}),1]](https://s0.wp.com/latex.php?latex=%7Bp_%7B%28i%29%7D%5E%7BHolm%7D%7D+%3D+min%5Bmax%28%28M+-+j+%2B+1%29%2A%7Bp_%7B%28j%29%7D%7D%29%2C1%5D+&bg=FFFFFF&fg=000000&s=0&c=20201002)

 with the least significant p-value 0.06.