Creative information designer who helps you communicate data in more innovative ways.


About Alli Torban

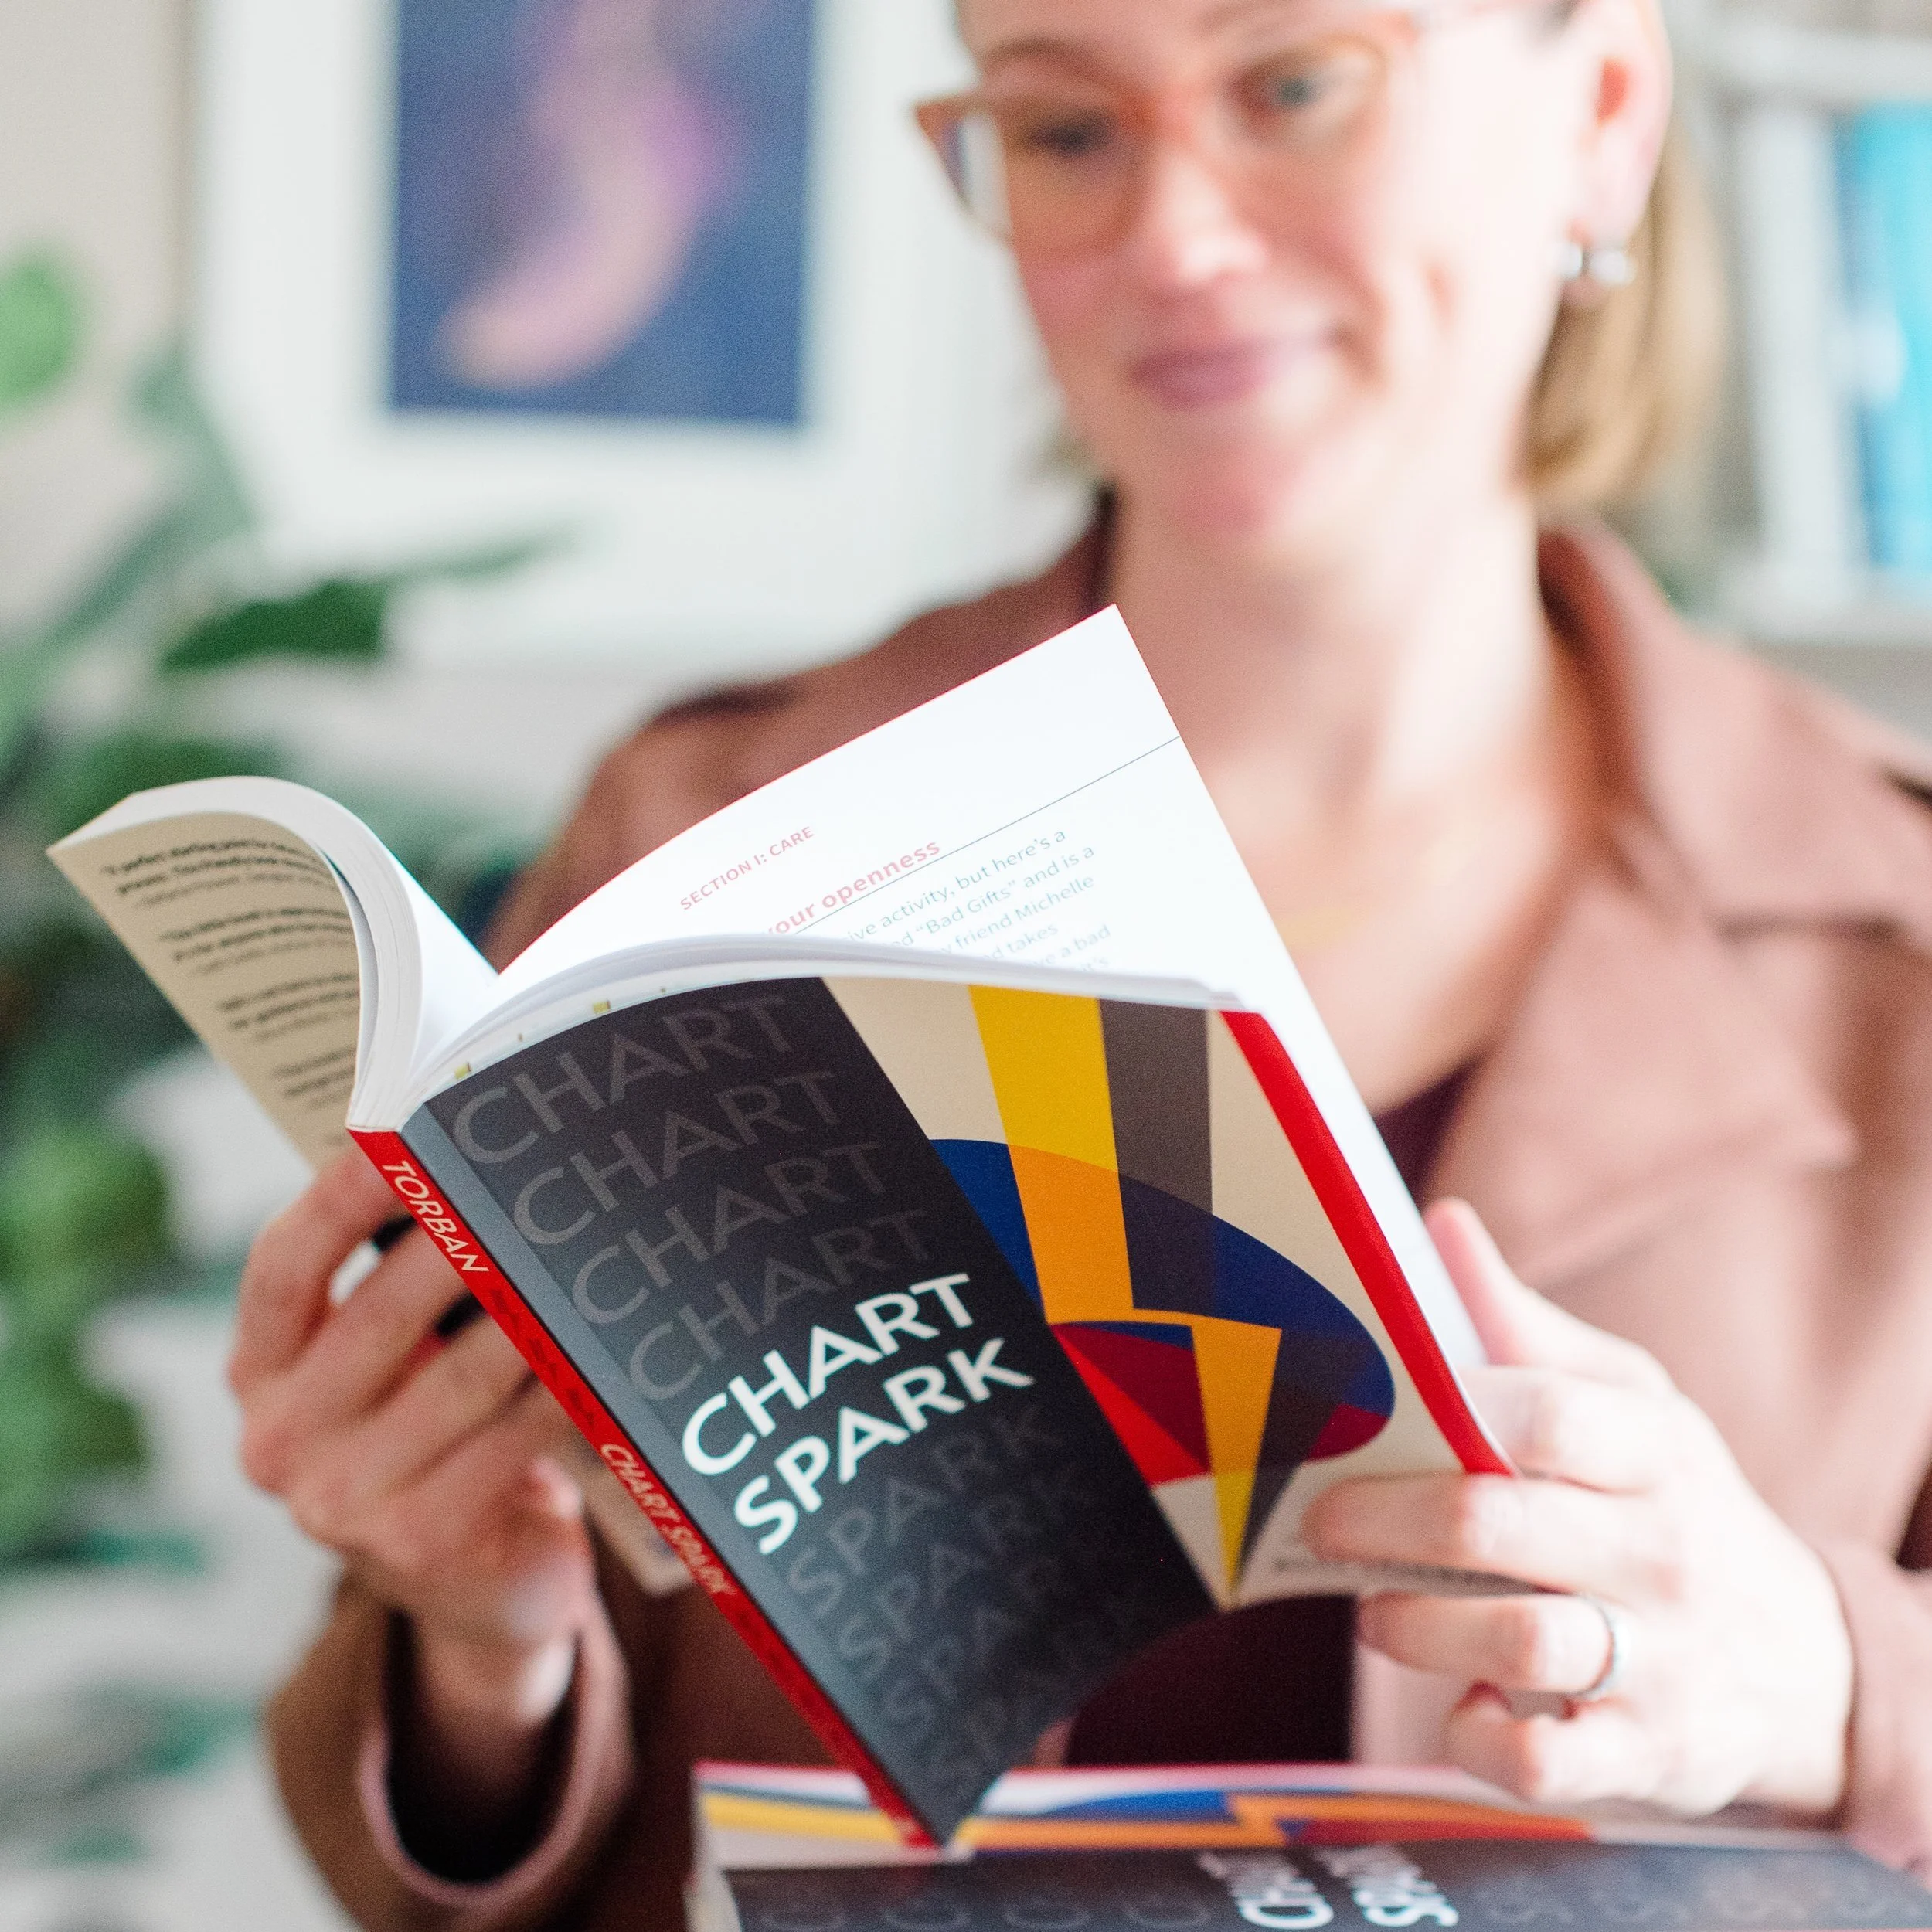
⚡ Hi! I’m ALLI TORBAN — author of Chart Spark and your go-to expert in creative information design. With a background in mathematics and geospatial intelligence, I began my career tackling data puzzles for government agencies, non-profits, and corporate clients in Washington, D.C.
In addition to creating impactful infographics, I’m on a mission to change the way people learn data literacy skills and inspire the next generation of creative information designers by delivering powerful keynotes at organizations such as Google and Moderna and sharing my work in premier publications like the Washingtonian, Axios, ACM Communications Magazine, and Significance Magazine.
I also co-founded the Elevate Dataviz Learning Community, where I've become a mentor to hundreds of budding practitioners. My passion and expertise have filled the episodes of my popular podcast, Data Viz Today, and also earned me the prestigious Impactful Community Leader award from the Data Visualization Society.
In my spare time, I'm likely walking to the library with my husband and two daughters or playing pickleball!
My work
-
![Image]()
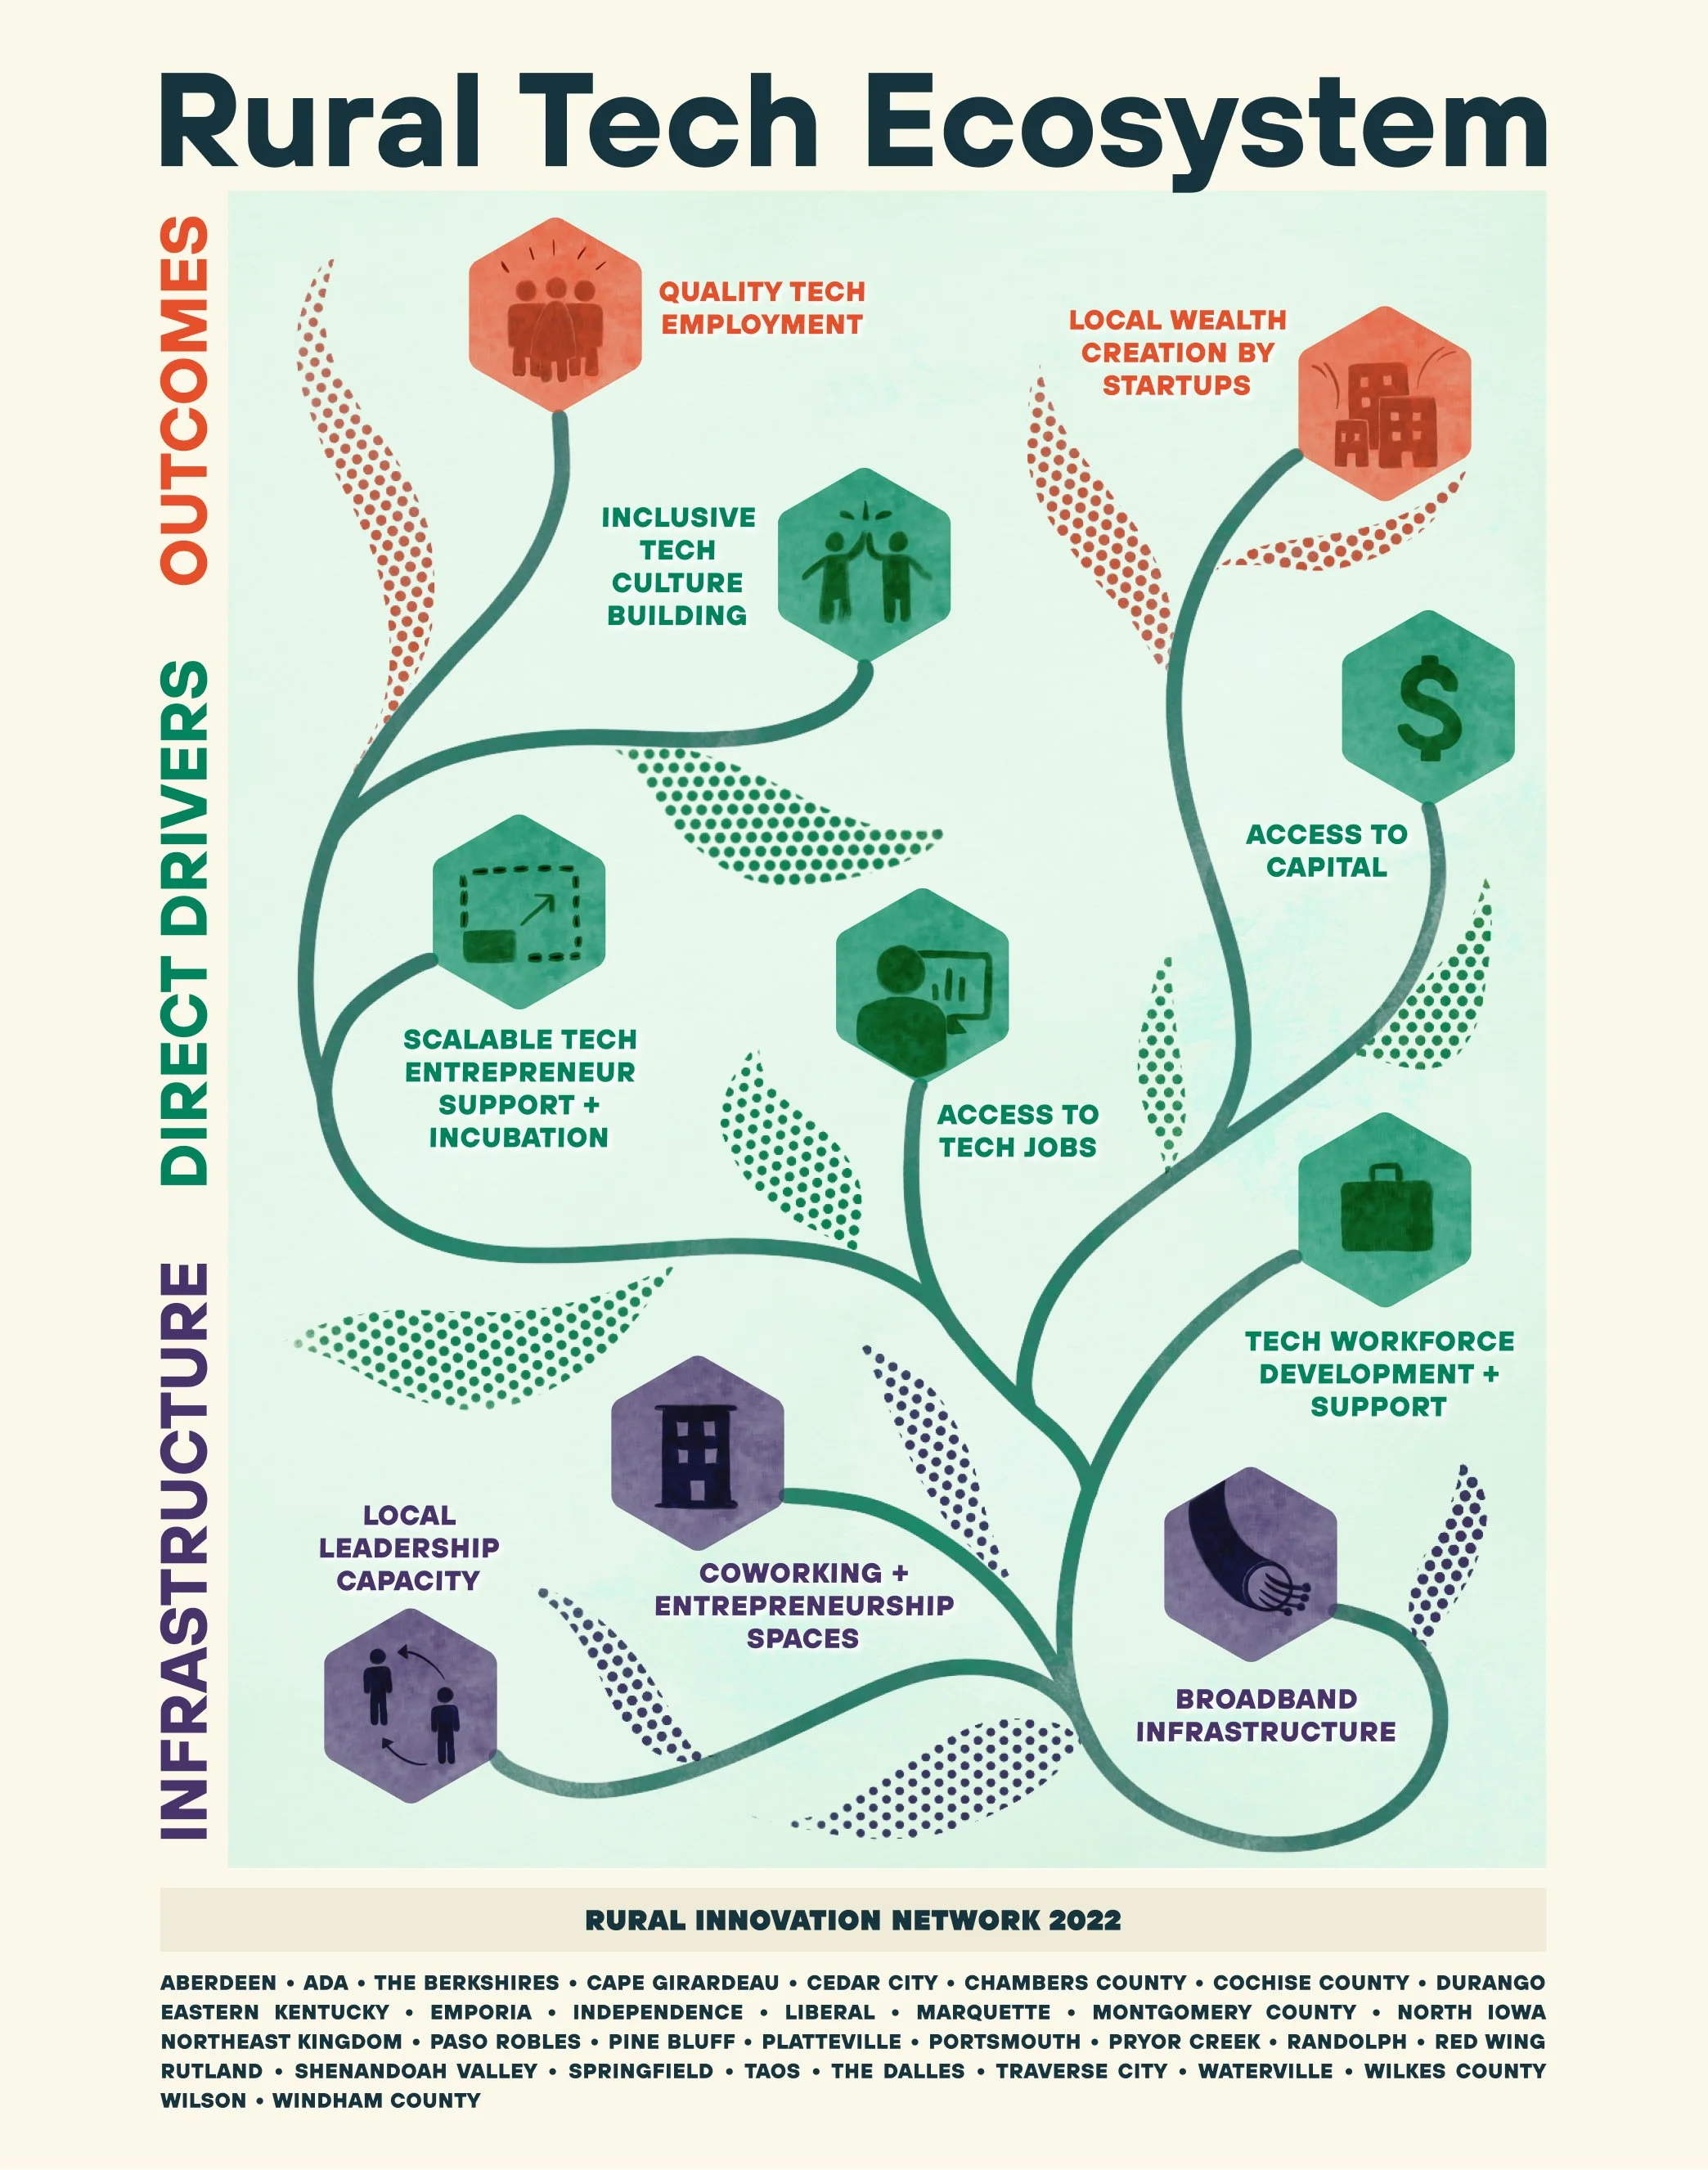
Uniting infographic
An organic, plant-inspired infographic that was used to unite the network of rural cities trying to transform their tech economy. Client: Center for Rural Innovation
-
![map showing flows from US to other countries who speak spanish]()
Animated presentation graphics
A series of graphics to show the depth and breadth of bilinguals in the U.S. Client: Steve Leveen, author of America the Bilingual
-
![Image]()
Songbird connections
When songbirds feed at the same time represented as an arc diagram in the shape of a feather. Client: me!
-
![Image]()
Research process diagram
An illustration that leans on the metaphor of an optic diagram to explain complex research, which increased reader understanding of the concept from 30% to 75%. Client: Eli Holder and Cindy Xiong, researchers published in IEEEVis
-
![Image]()
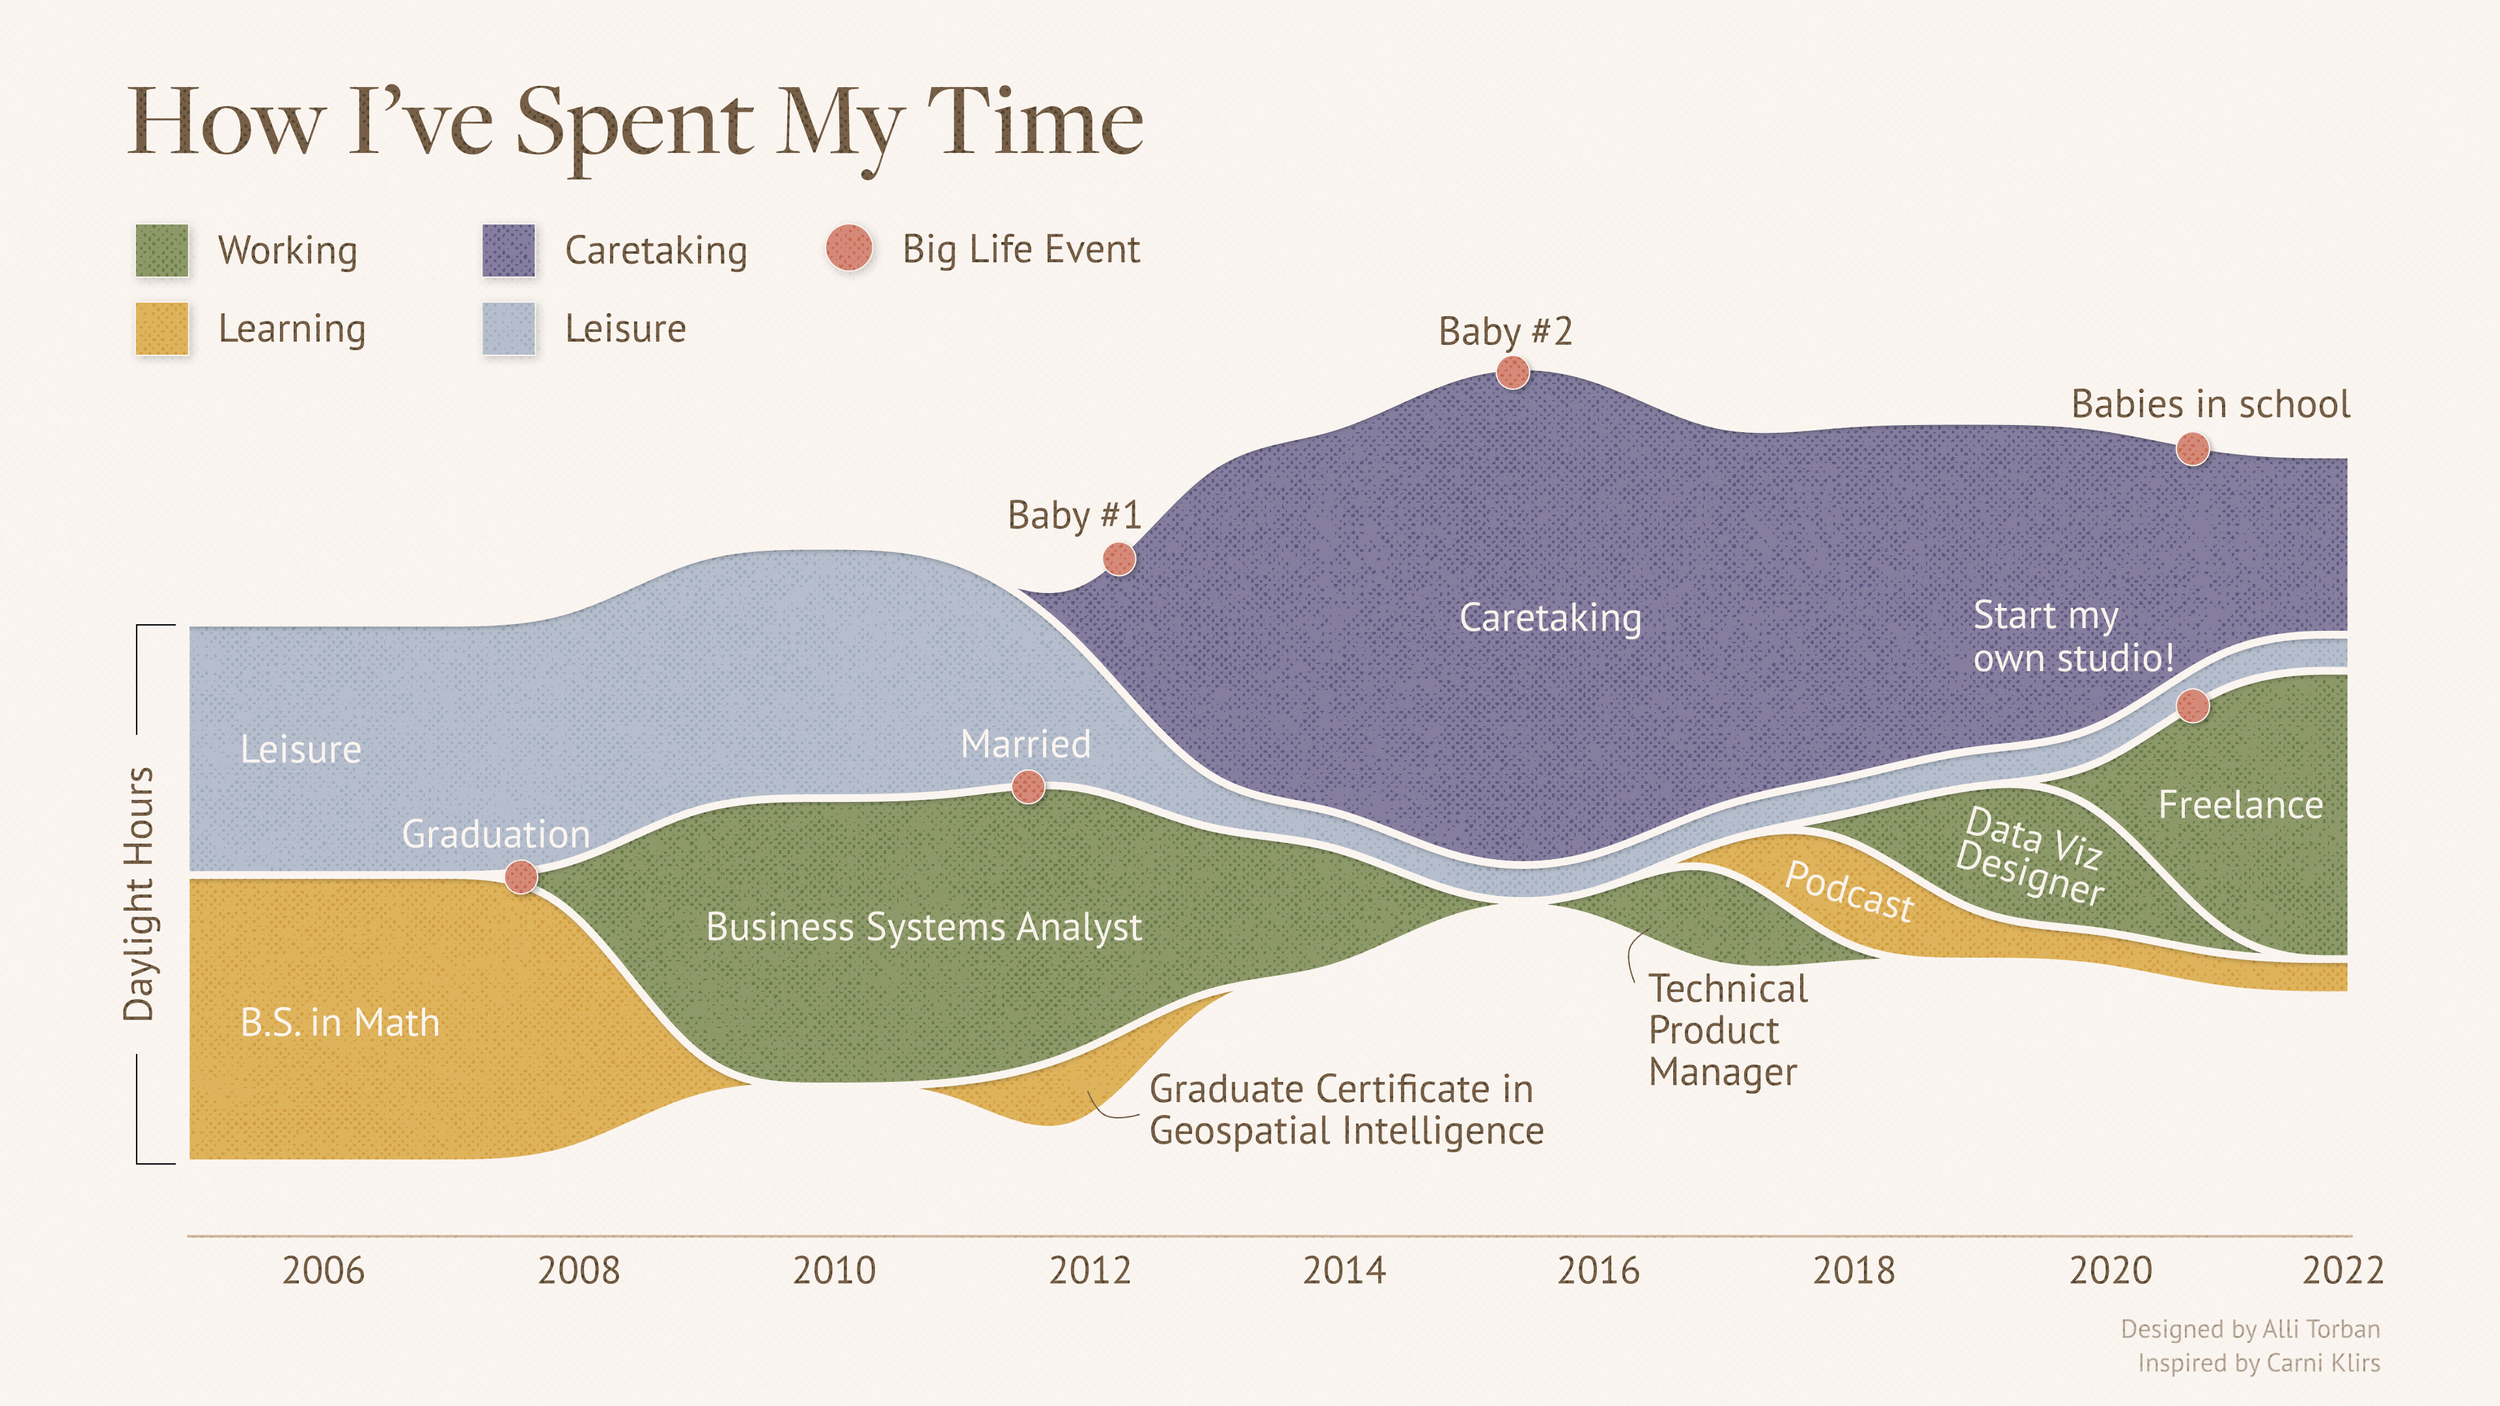
Stream of my career
My career is represented by a stream graph showing the ebb and flow of responsibilities. More than half a million views on social. Client: me!
-
![Image]()
Welcoming data comic
A friendly way to explain the Data-Information-Knowledge-Wisdom pyramid with the metaphor of a seed, which inspired a team to pursue data literacy training. Client: Data Literacy LLC
-
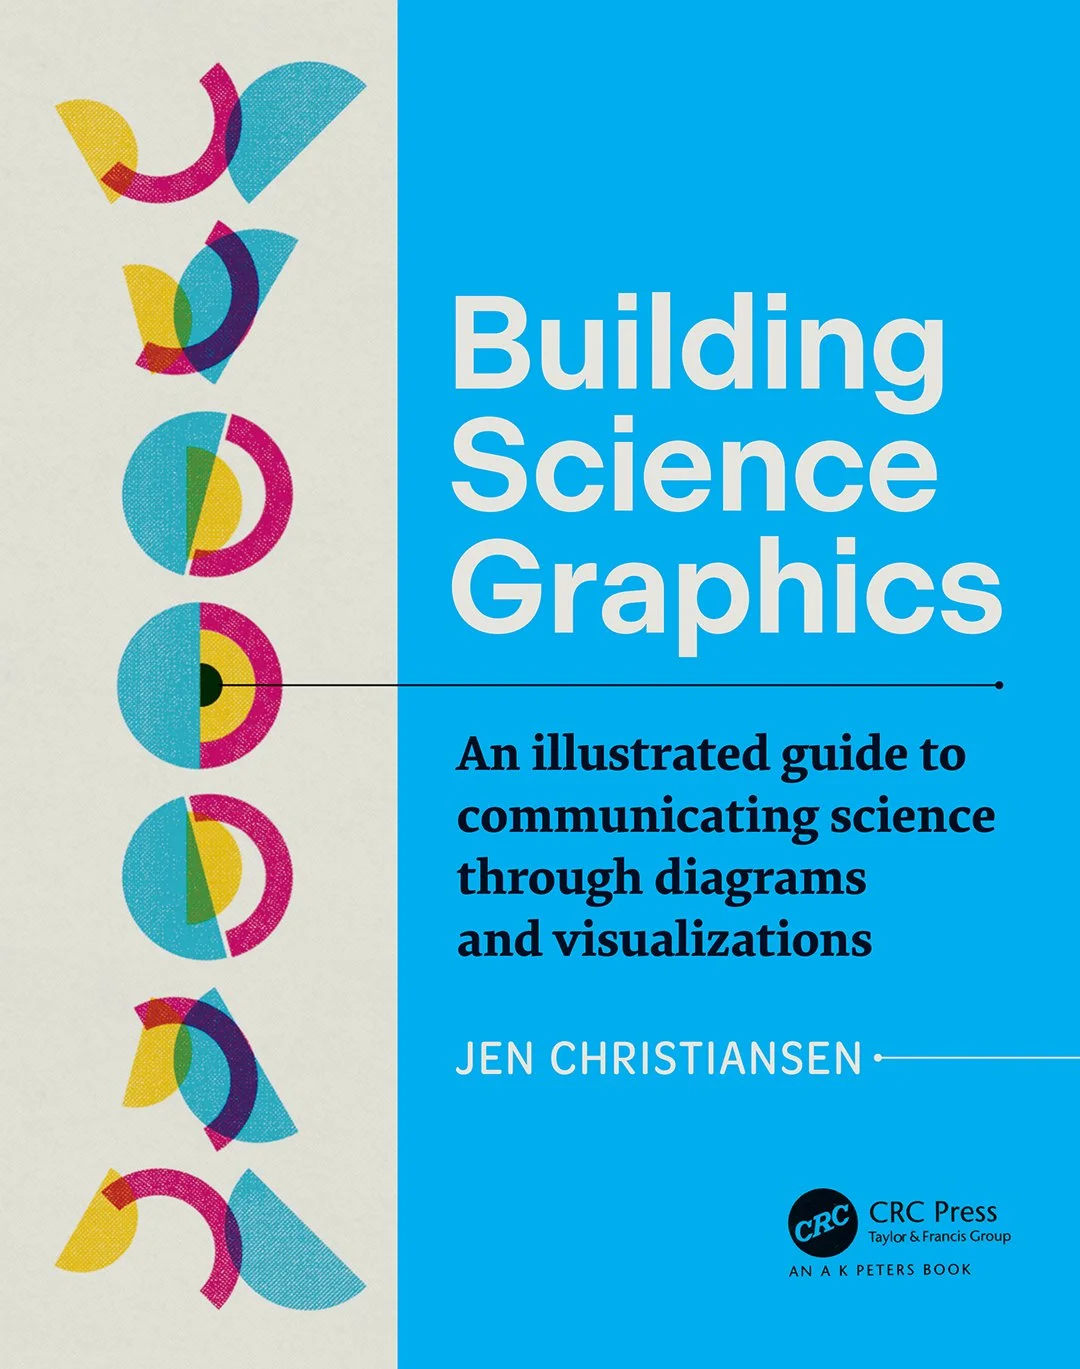
![Image]()
Eye-catching book cover
Illustration that quickly conveys the concepts “building” and “science” with shapes representing the cross-section of the Earth, a DNA helix, and moon phases — all in one elegant image. Client: Jen Christiansen, graphics editor at Scientific American
-
![Image]()
Disease prevalence vs incidence
The difference between disease prevalence and incidence as the setup of a board game. The most-viewed blog post on dataliteracy.com. Client: Data Literacy LLC
-
![Image]()
Corn supply chain
How the supply chain was broken in multiple places represented as a chain-link fence. Client: Axios Media
-
![Image]()
Media manipulation
The descending cycle of harmful media manipulation. Research transformed into a series of engaging vignettes. Client: Axios Media
-
![Image]()
Jumping through hoops
Visualization of the steps of my design process. Client: me!
-
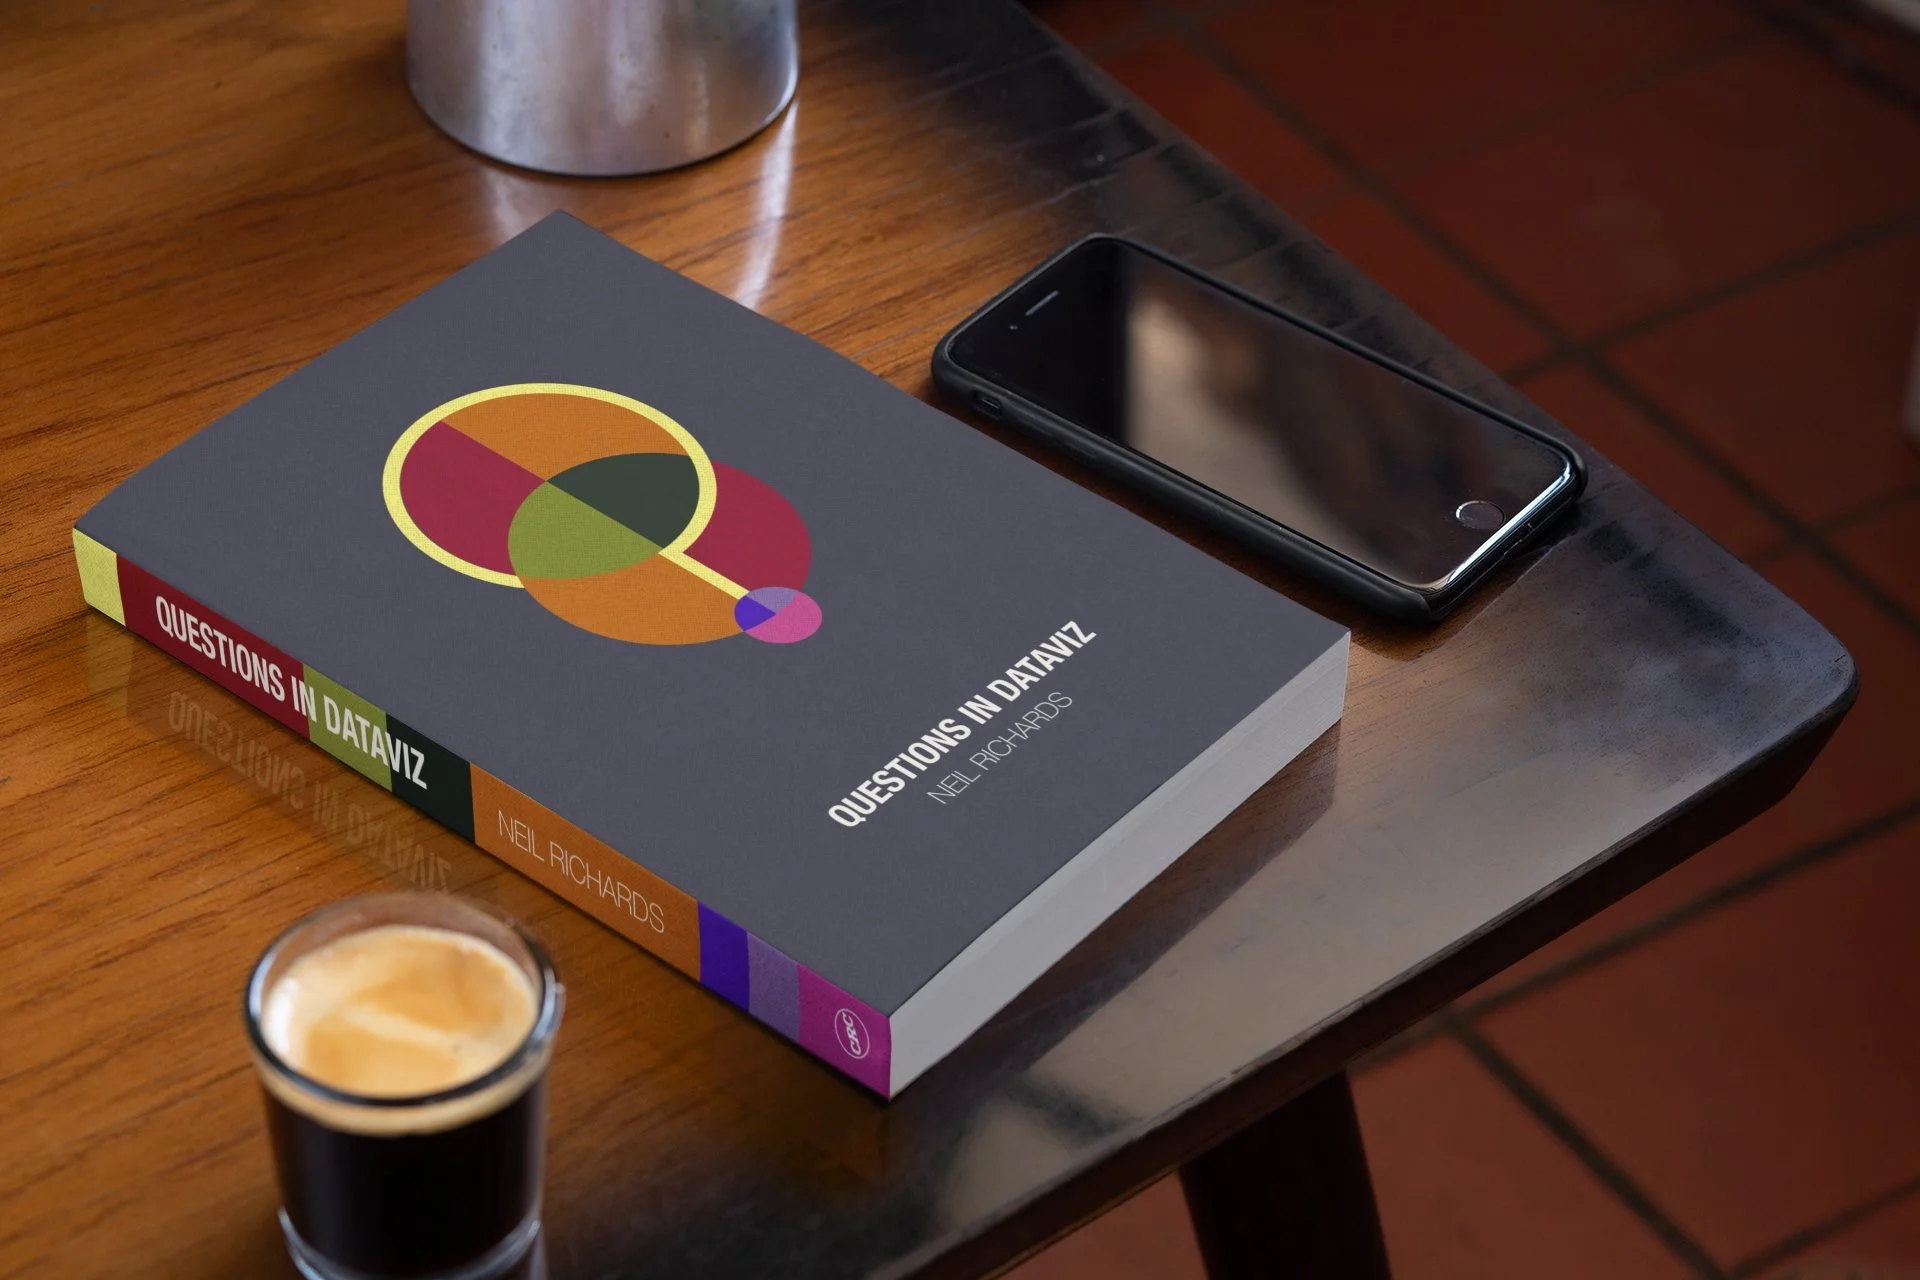
![Image]()
Modern book cover
A question mark integrated into shapes related to data visualization for the book “Questions in DataViz” (CRC Press). Client: Neil Richards, Global Data Fluency Lead at JLL
-
![Image]()
Bee stressors
What stresses bees out the most in each state presented as a beeswarm chart. Client: Data Literacy LLC
-
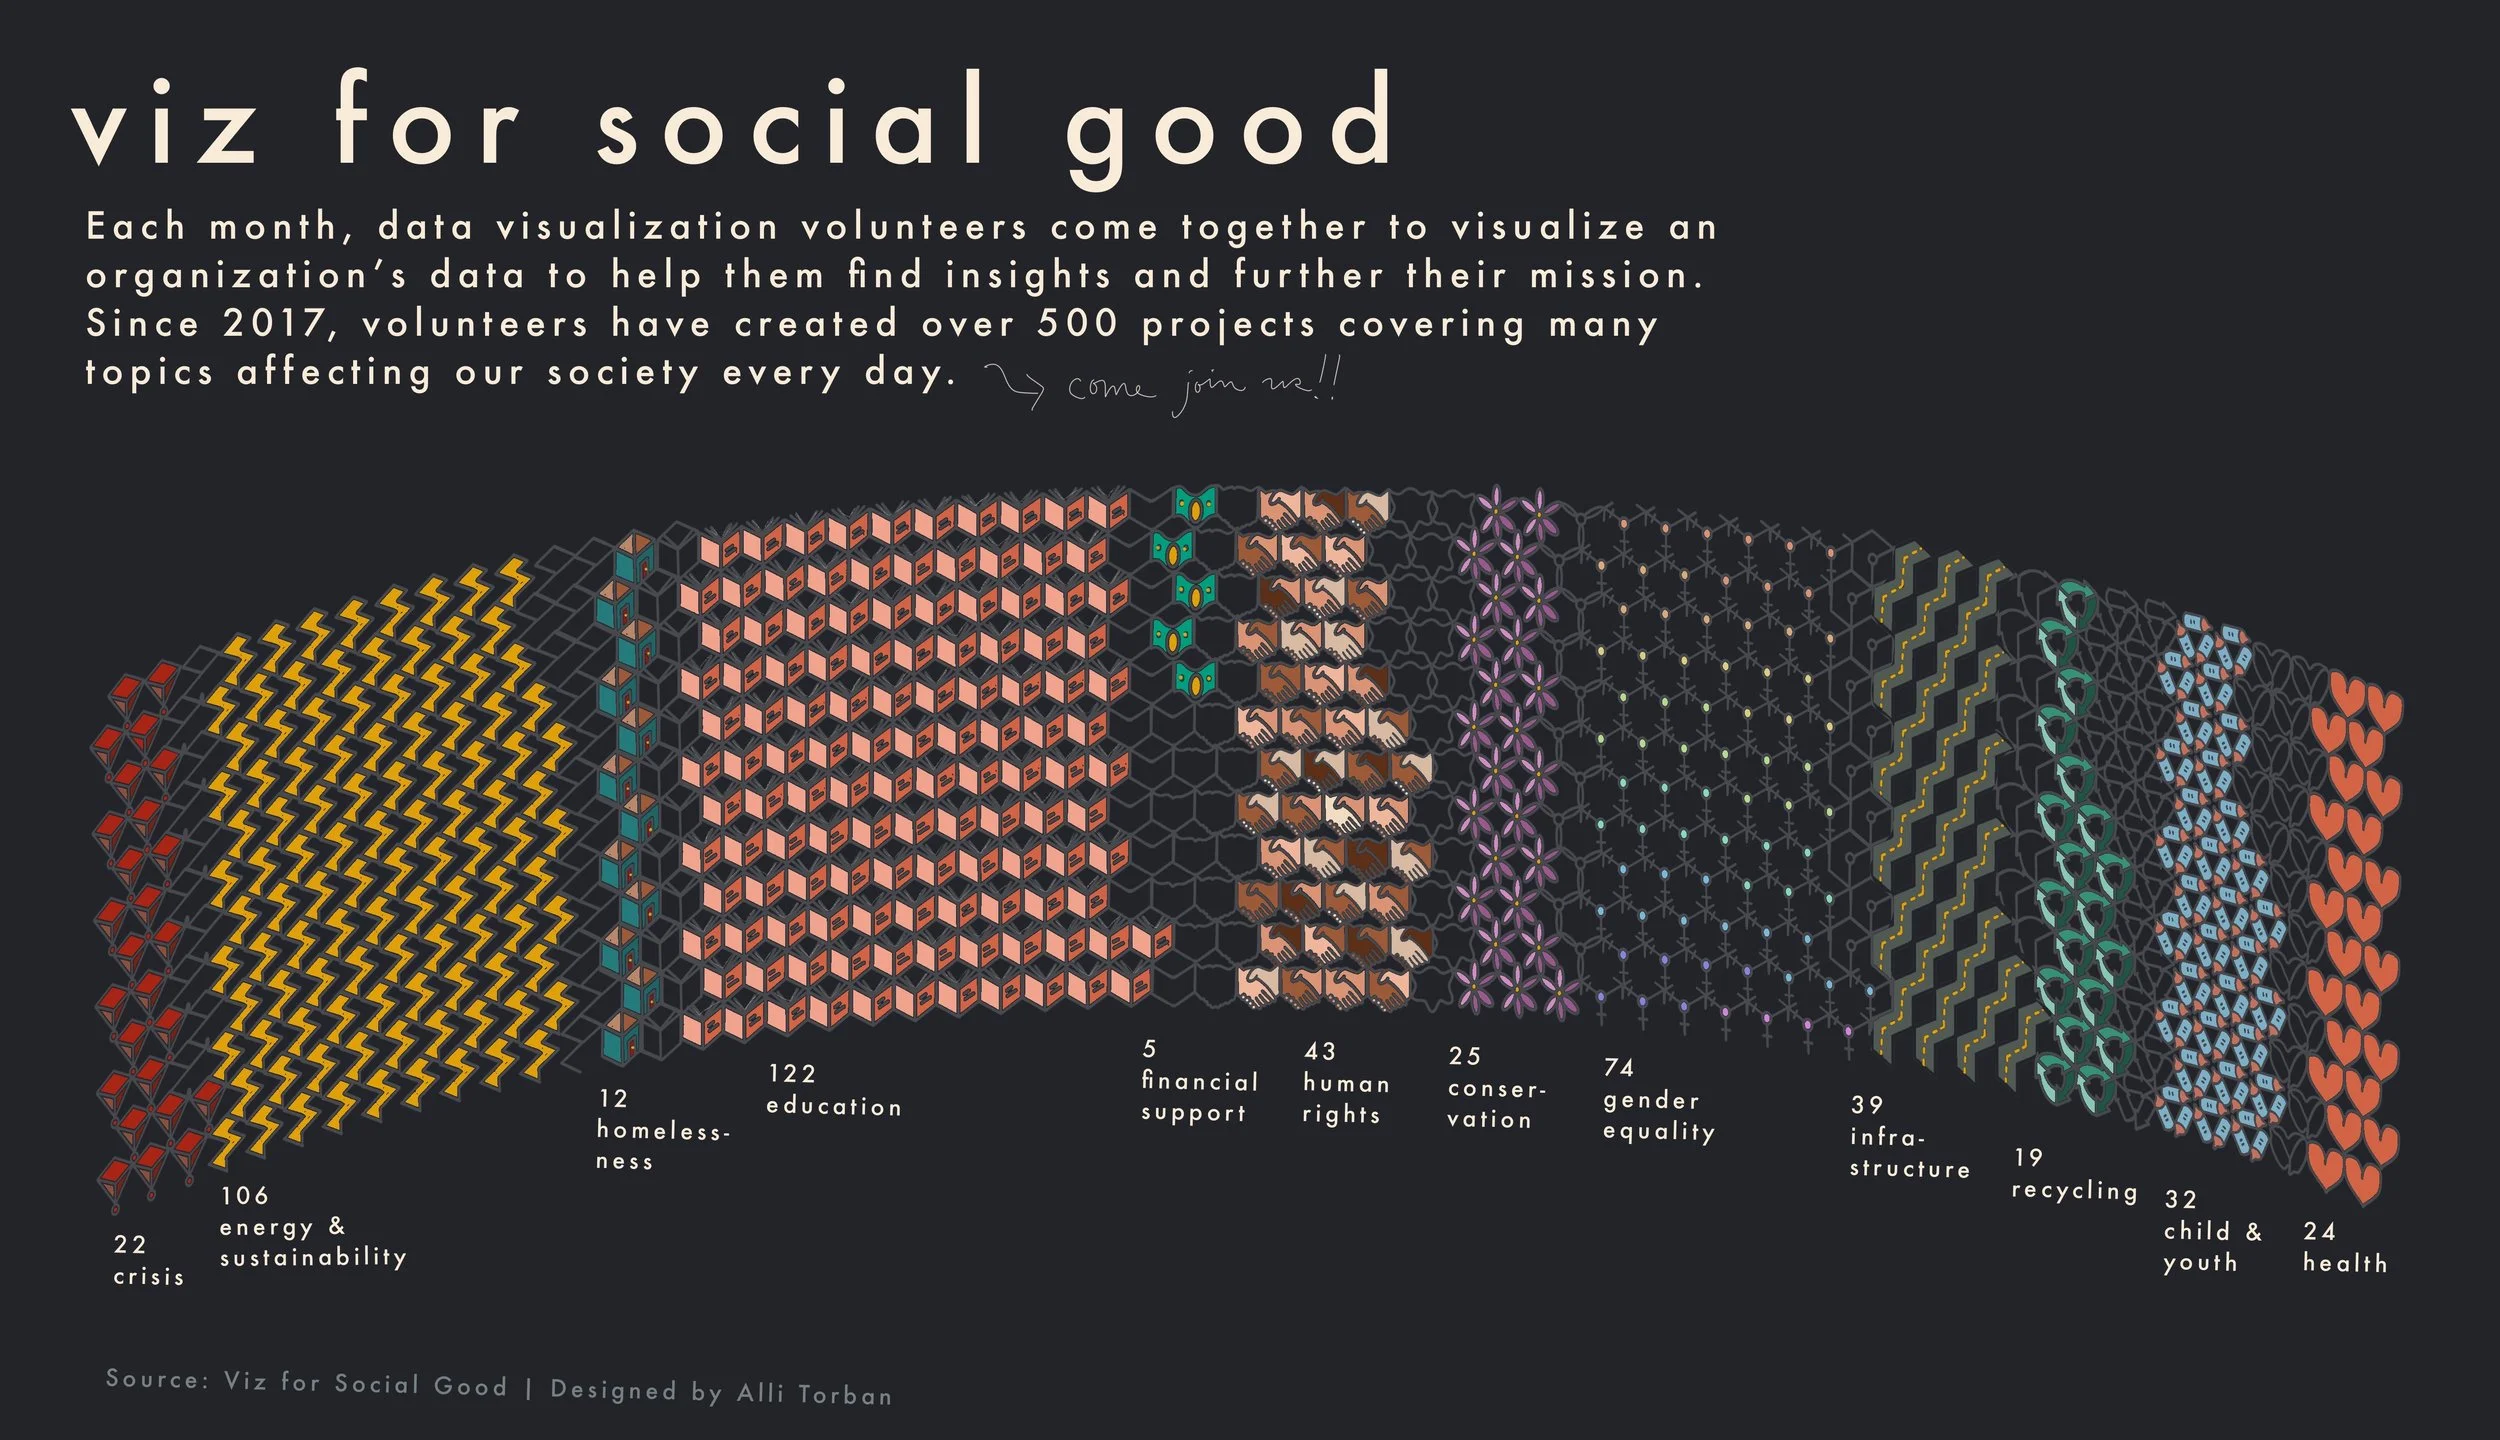
![Image]()
Social good projects
The types of projects completed are represented as a tessellated unit chart. Client: Viz For Social Good non-profit


Kind words from happy clients…

Awards & Features
Featured magazine spread in the Royal Statistical Society’s Significance Magazine 2024 // Data Visualization Society’s Nightingale Journal book review of Chart Spark 2024 // Interview on The Plot by Evelina Judeikyte 2024 // Voilà’s Book Review of Chart Spark 2024 // Data Visualization Society’s Information is Beautiful Awards Impactful Community Leader 2022 // LinkedIn Learning Data Visualization Series 2022 // Axios 2021 here and here // Flowing Data 2020 & 2021 // Communications of the ACM Magazine 2021 // Data Literacy 2021 // BuiltIn Tech 2021 // Washingtonian Magazine 2020 // Data Visualization Society Journal here, here, here and here // Italian Design Magazine Frizzifrizzi 2020 // Information is Beautiful Awards Longlisted data visualizations 2018 & 2019 // Andy Kirk’s Best of the Visualisation Web: February, May, September, January // Market Cafe Magazine: Issue 6 // Visme’s 25 Best Data Visualizations // Arlington Magazine here and here // Podcast Movement here
Speaking
Interview on Stats+Stories podcast 2025 // Interview on Storytelling with Data podcast 2024 // Interview on the Data Career Podcast 2024 // Interview on Insights x Design podcast 2024 // Interview on Chart Chat 2024 // Interview on The Art of Communicating Data podcast 2024 // Department of Education Vizpalooza 2024 // Moderna internal event 2024 // Dataviz DC Meetup 2024 // Data Visualization Society’s Outlier 2023 // Google’s Measurement and Analytics internal summit 2022 // Georgetown University Business School - Guest Lecturer // Maryland Institute College of Art - Guest Lecturer // Data + Women Tableau Global Event // Financial Modelling Summit 2022 // Graphic Hunters Conference Visualising Impact // The Assurance Show episode #32 // Data Stories podcast episode #133 // Designed Today podcast episode #54 // Data Talks podcast episode #14 // Data2Dome keynote: “How to Fill Your Data Viz Toolbox” // Urban Institute: “Decoding DataViz: How to Fact Check Charts and Visuals” panel discussion // Tom Tom Fest: “How to Get Your Results Seen & Understood More Quickly Using Visual Metaphor” // University of Ottawa’s School of Information Studies: Guest lecture on Data Storytelling
Contact me
Information Design Projects: I love helping my clients share information in a way that sparks those ‘AH-HA’ moments! Once we’ve had a Discovery call and signed a contract, I’ll walk you through my design process:
Requirements & Art Direction: We discuss project goals, audience, success criteria, and desired aesthetics.
Sketch & Ideation: I research and develop concepts based on data and design constraints, then present sketches for feedback.
Feedback & Collaboration: We maintain constant communication to ensure sketches meet success criteria, ideally involving user testing.
Final Inking & Delivery: I finalize the graphics, review them with you, and export the files as per your specifications.
Speaking Engagements: I love inspiring teams and providing them with tools they can immediately use to discover new ideas! Please share more information about your event in the form below, and I’ll send over my Speaker One-Sheet. Here are a couple of my popular topics:
Boost Your Team’s Creative Collaboration with Data: In this keynote, I’ll share a fresh take on creativity in data communication and three simple exercises that work for any collaboration style. Whether some of your teammates thrive on interactive brainstorming or others need time to process, these techniques help everyone contribute and spark better ideas.
Your Practical Roadmap to Innovative Data Communication: In this keynote, I’ll share my process for brainstorming ideas that can transform basic charts into more creative, engaging graphics. You’ll walk away with practical techniques to generate innovative ideas in your own work—whether you’re collaborating with a team or working solo.